
view#
- pypillometry.view(data, variables=None, eyes=None, time=None, overlay_pupil=None, overlay_x=None, overlay_y=None, extra_plots=None, highlight=None, highlight_color='lightblue')[source]#
View eye-tracking data or numpy arrays with GPU-accelerated rendering.
Opens an interactive viewer window using VisPy for fast GPU-based rendering. Suitable for long recordings (60+ minutes at 1000 Hz).
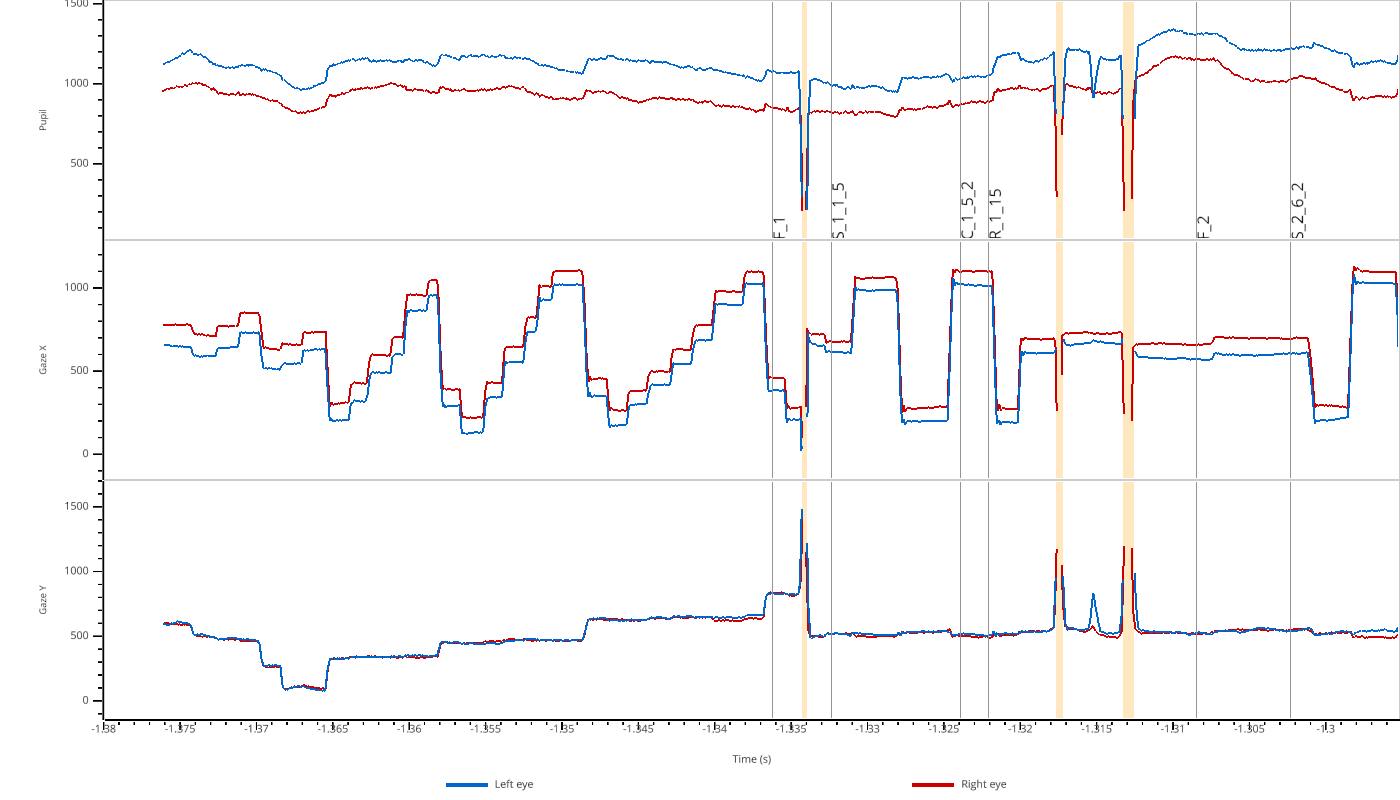
See GPU-Accelerated Viewer (pp.view) for more examples.
- Parameters:
data (EyeData, ndarray, list of ndarrays, or dict) –
Data to view. Supports multiple input types:
EyeData object: Eye-tracking data with tx attribute and dictionary-like access to modalities (left_pupil, right_x, etc.)
ndarray or MaskedArray: Single array displayed as one plot
list of arrays: Multiple arrays overlaid in one plot with different colors
dict of arrays: Keys become plot labels (y-axis), values are arrays or lists of arrays. Example:
{"upper": [x, y], "lower": z}creates two subplots with x,y overlaid in “upper” and z in “lower”
variables (list of str, optional) – For EyeData objects only. Filter which modalities to display. Valid values: ‘pupil’, ‘x’, ‘y’. Default: show all available. Example:
variables=['pupil']shows only pupil data.eyes (list of str, optional) – For EyeData objects only. Filter which eyes to display. Example:
eyes=['left']shows only left eye data. If not provided, all available eyes are detected and displayed.time (ndarray, optional) – Time vector for raw array viewing. If not provided, uses sample index (0, 1, 2, …). Should have same length as data arrays. Ignored for EyeData objects, where data.tx (converted to seconds) is used.
overlay_pupil (dict, optional) –
(EyeData only) Additional timeseries to overlay on the pupil plot. Keys are labels for legend, values are either:
str: name of data in eyedata.data (e.g., ‘left_pupil_filtered’)
array-like: timeseries of same length as eyedata
Overlays with an unknown key or a wrong length are skipped with a warning.
overlay_x (dict, optional) – (EyeData only) Additional timeseries to overlay on the gaze X plot.
overlay_y (dict, optional) – (EyeData only) Additional timeseries to overlay on the gaze Y plot.
extra_plots (dict, optional) – (EyeData only) Additional numpy arrays to display as separate subplots below the EyeData variables. Keys become subplot labels (y-axis), values are arrays or lists of arrays. Arrays must have the same length as the EyeData. Example:
extra_plots={"velocity": vel, "custom": [a, b]}highlight (Intervals or dict, optional) –
Intervals to highlight in the plots. Can be:
An
Intervalsobject (applied to all plots)A dict mapping plot key to
Intervalsobjects; keys are ‘pupil’, ‘x’, ‘y’ and'extra_<label>'for extra_plots (EyeData), or the plot labels (arrays)
Intervals in time units are converted to seconds; Intervals in sample indices (
units="samples") are placed using the time vector. For raw arrays without time, the x-axis is in sample indices and only Intervals in sample indices can be shown.highlight_color (str, optional) – Color for highlighted regions (default: ‘lightblue’)
- Return type:
- Returns:
If regions were selected (
Skey, then drag with the left mouse button), returns a dict mapping plot key (same keys as for highlight) toIntervalsobjects containing the selected regions withunits='sec'; for raw arrays without time the values are sample indices (units="samples"). Returns None if no selections were made.- Raises:
ValueError – If arrays have different lengths.
TypeError – If data type is not supported.
Notes
Keyboard controls:
Left/Right arrows: Pan 10% of view
Up/Down arrows: Zoom in/out (20%/25%)
PgUp/PgDn: Pan 50% of view
Home/End: Jump to start/end
Space: Reset to full view
+/-: Zoom in/out
Mouse wheel: Zoom X-axis around the mouse position
Shift + Up/Down, Shift + mouse wheel: Zoom Y-axis of the plot under the mouse
Shift + Space: Reset Y-axis of the plot under the mouse
M: Toggle mask regions (EyeData only)
O: Toggle event markers (EyeData only)
S: Enter/exit selection mode (drag to mark a region)
D/Backspace: Remove last selection
H/?: Show help
Q/Esc: Close viewer (Esc first leaves selection mode)
Examples
View EyeData:
>>> import pypillometry as pp
>>> data = pp.EyeData.from_eyelink('recording.edf')
>>> pp.view(data)
>>> pp.view(data, variables=['pupil'])  # Only show pupil plots
>>> pp.view(data, eyes=['left'])  # Only show left eye data
View numpy arrays:
>>> import numpy as np
>>> x = np.random.randn(1000)
>>> y = np.random.randn(1000)
>>> pp.view(x)  # Single array
>>> pp.view([x, y])  # Multiple arrays in one plot
>>> pp.view({"Signal 1": x, "Signal 2": y})  # Two separate plots
>>> pp.view({"upper": [x, y], "lower": x + y})  # Complex layout
With time vector:
>>> t = np.linspace(0, 10, 1000)  # 10 seconds
>>> pp.view(x, time=t)
EyeData with overlays:
>>> smoothed = np.convolve(data['left_pupil'], np.ones(100)/100, 'same')
>>> pp.view(data, overlay_pupil={'smoothed': smoothed})