
GPU-Accelerated Viewer (pp.view)#
The view() function provides a GPU-accelerated interactive viewer for exploring eye-tracking data. It is designed for smooth navigation of long recordings (60+ minutes at 1000 Hz) using VisPy for OpenGL rendering.
Keyboard shortcuts: Press H or ? in the viewer to see all available keyboard shortcuts for navigation, zooming, and toggling display options.
Viewing EyeData Objects#
The simplest use case is viewing an EyeData object directly:
import pypillometry as pp

eyedata = pp.get_example_data("rlmw_002_short")
eyedata.pupil.blinks_detect()
pp.view(eyedata)
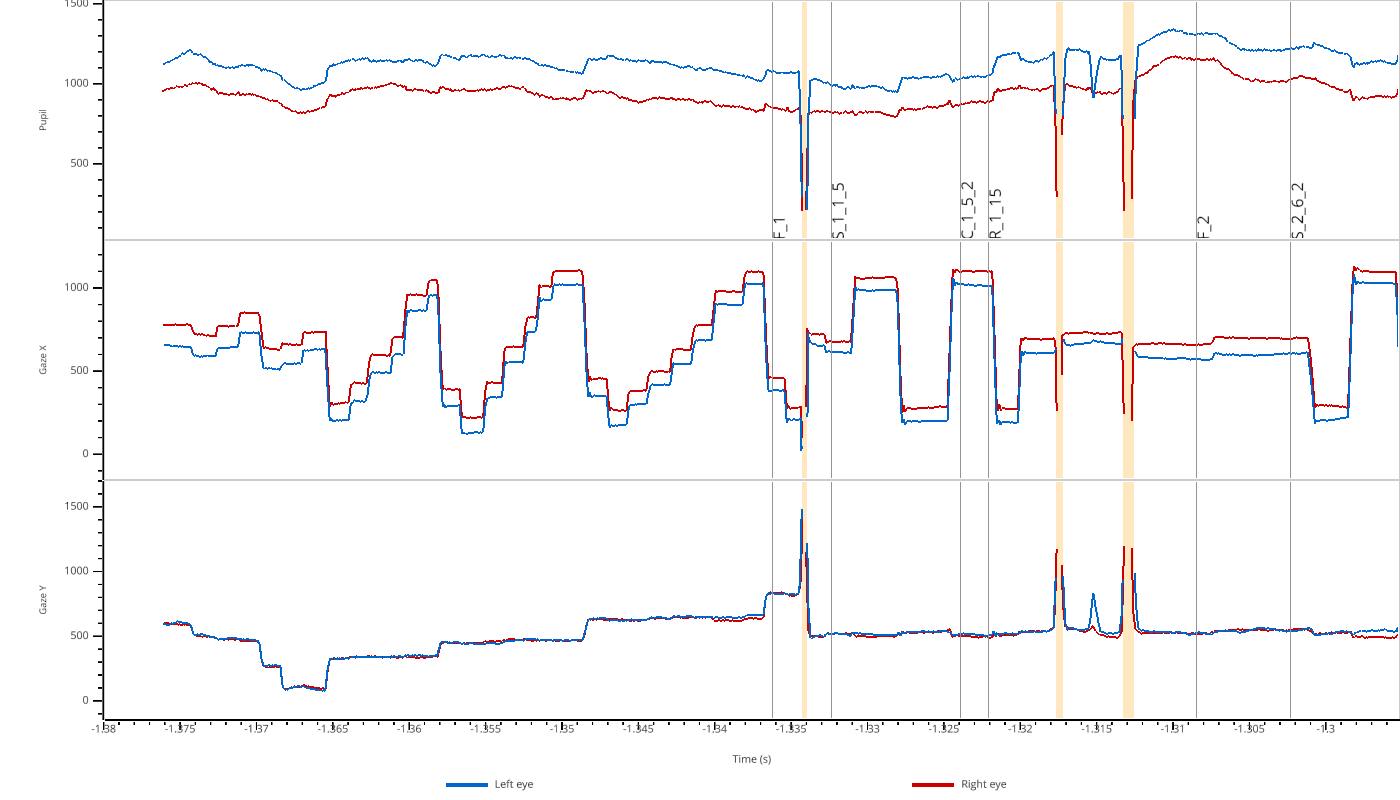
The viewer automatically creates subplots for each modality (pupil, x, y) and shows both left (blue) and right (red) eye data. Masked regions (here, the detected blinks) are highlighted in orange. Event labels are shown when you zoom in far enough that at most ten events are visible.
Viewing Numpy Arrays#
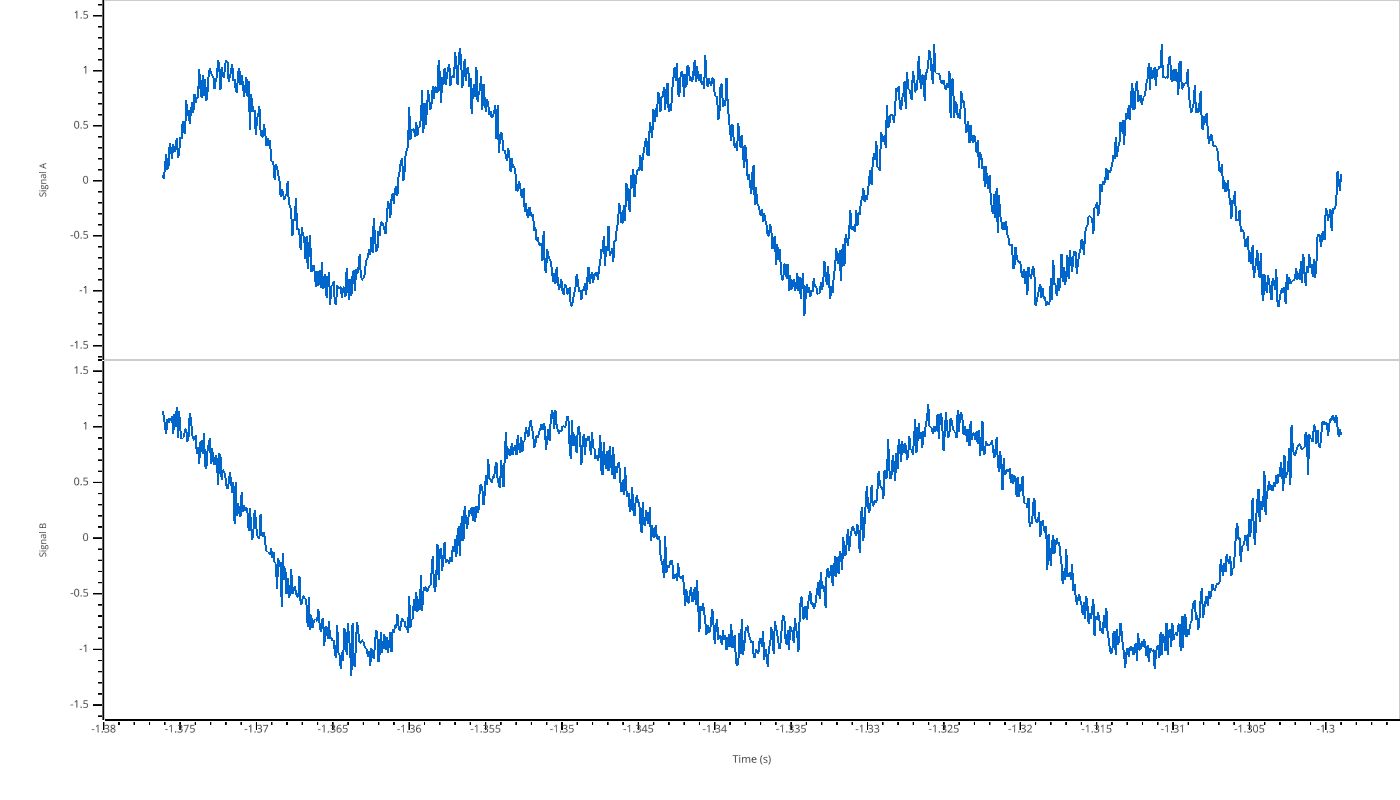
You can also view raw numpy arrays. Use a dictionary to create multiple subplots:
import numpy as np
import pypillometry as pp

# Create synthetic signals
t = np.linspace(0, 10, 1000)
signal_a = np.sin(2 * np.pi * 0.5 * t) + np.random.randn(1000) * 0.1
signal_b = np.cos(2 * np.pi * 0.3 * t) + np.random.randn(1000) * 0.1

pp.view({"Signal A": signal_a, "Signal B": signal_b}, time=t)
Filtering Variables#
For EyeData objects, you can filter which modalities to display using the variables parameter:
import pypillometry as pp

eyedata = pp.get_example_data("rlmw_002_short")
pp.view(eyedata, variables=["pupil"])
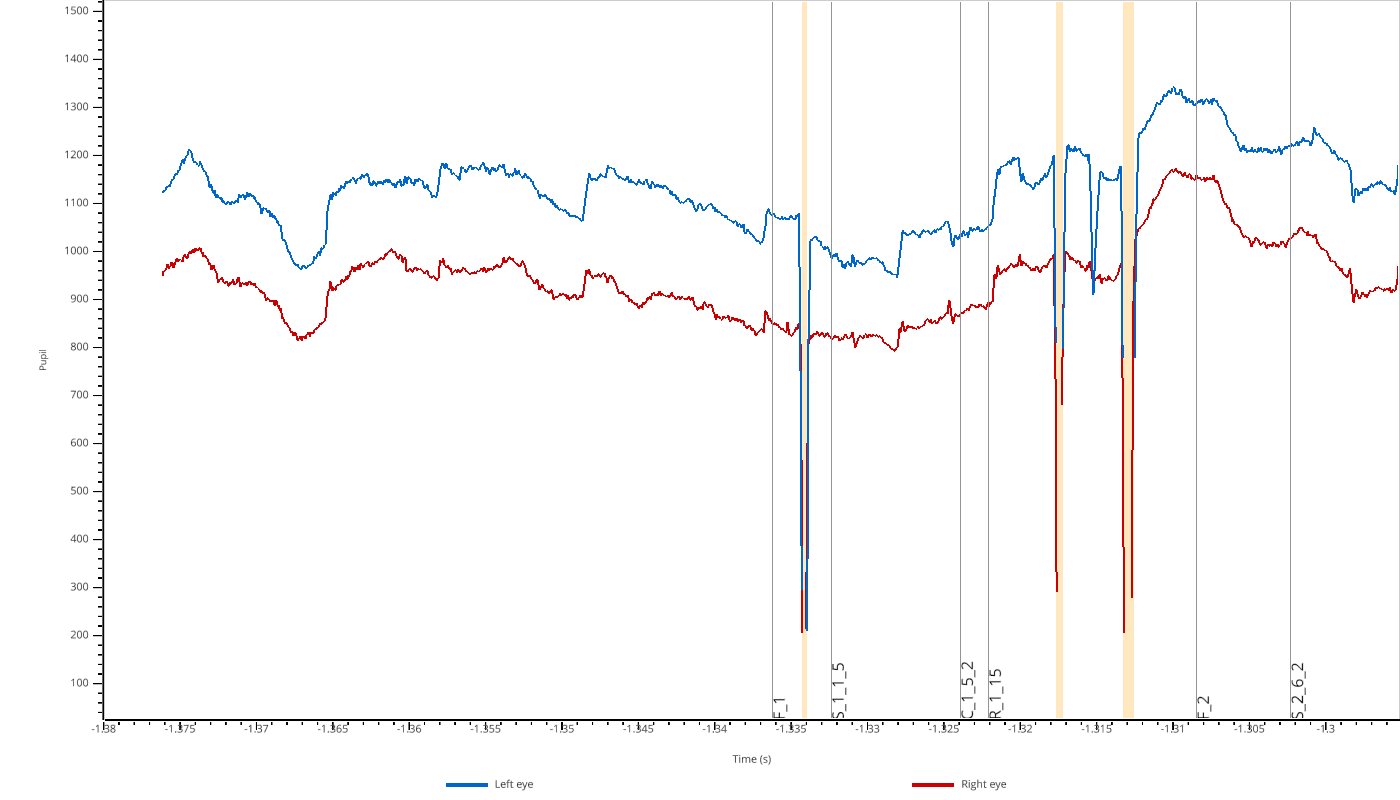
Valid values are 'pupil', 'x', and 'y'. Similarly, eyes selects the eyes to display (default: all available eyes):
pp.view(eyedata, variables=['pupil'], eyes=['left'])
Adding Overlays#
You can overlay additional data on top of the main plots for comparison. This is useful for visualizing the effect of processing steps:
import numpy as np
import pypillometry as pp

eyedata = pp.get_example_data("rlmw_002_short")
smoothed = eyedata | pp.pupil.lowpass_filter(cutoff=2)

pp.view(eyedata, variables=["pupil"],
        overlay_pupil={"smoothed": smoothed["left_pupil"]})
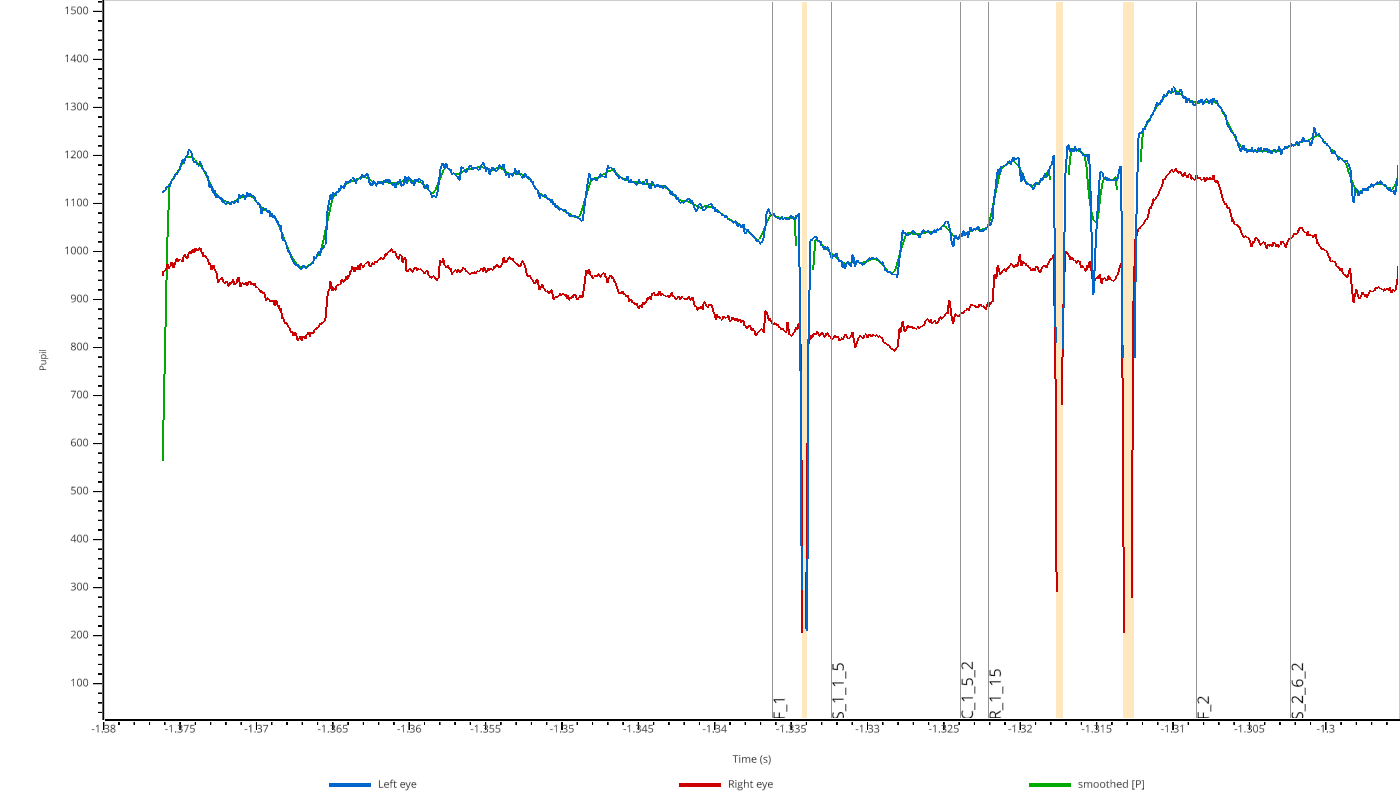
Use overlay_pupil, overlay_x, or overlay_y to add overlays to the respective subplots.
Extra Subplots#
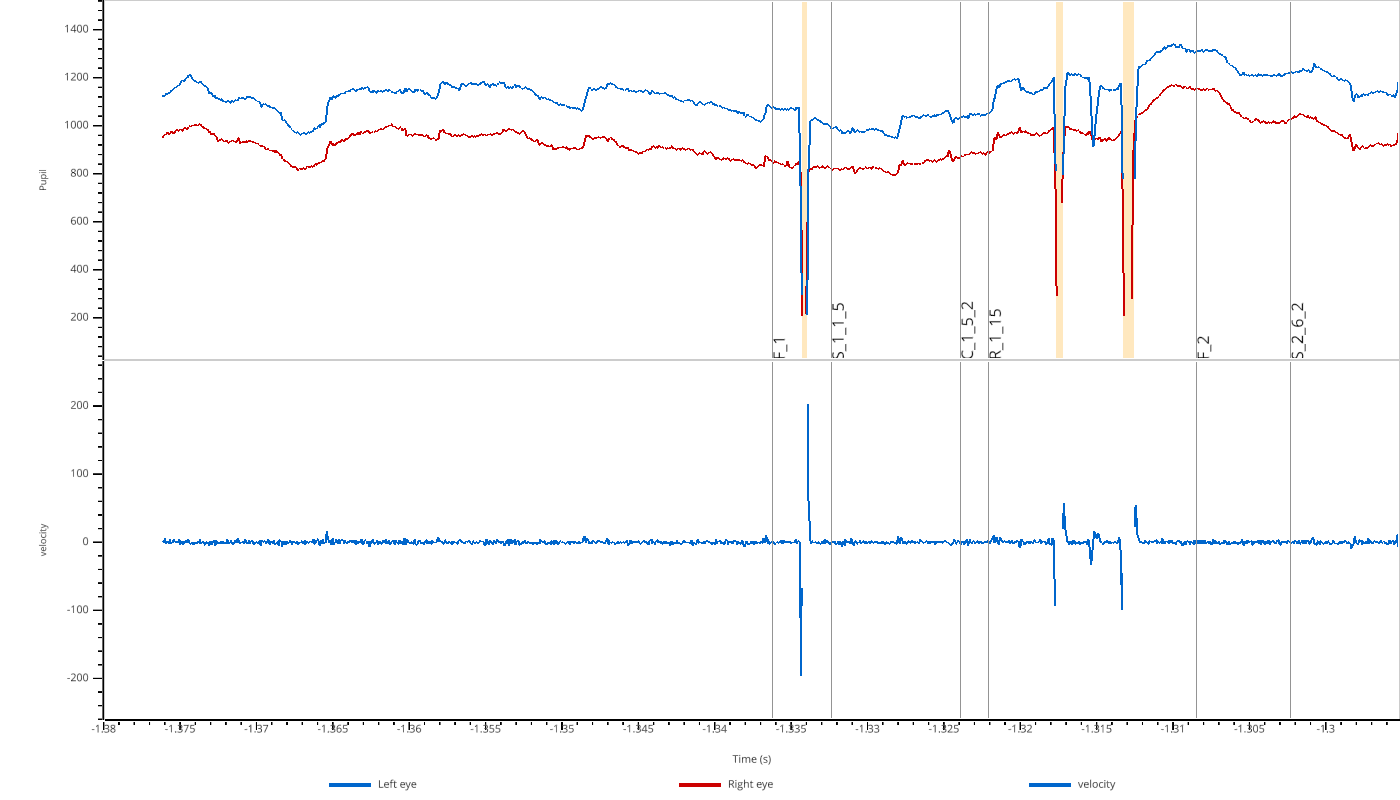
You can add additional subplots below the main EyeData variables using extra_plots:
import numpy as np
import pypillometry as pp

eyedata = pp.get_example_data("rlmw_002_short")

# Compute velocity (derivative of pupil size)
pupil = np.array(eyedata["left_pupil"])
velocity = np.gradient(pupil)

pp.view(eyedata, variables=["pupil"], extra_plots={"velocity": velocity})
Highlighting Intervals#
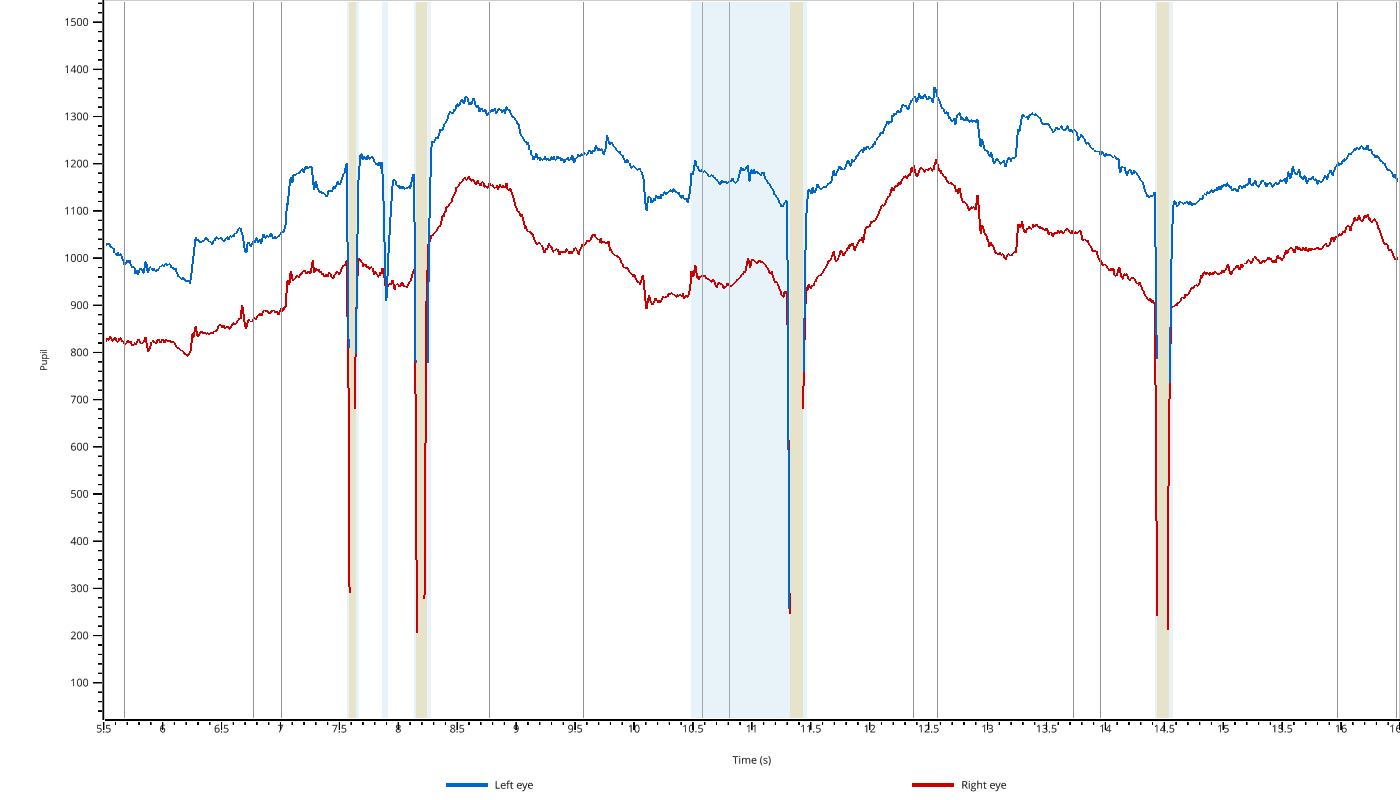
Use highlight to shade Intervals (e.g., detected blinks) in the plots, and highlight_color to change their color (default 'lightblue'):
import pypillometry as pp

eyedata = pp.get_example_data("rlmw_002_short")
blinks = eyedata.pupil.blinks_detect(eyes="left").get_blinks("left", "pupil")["left_pupil"]

pp.view(eyedata, variables=["pupil"], highlight=blinks)
To use another color or to highlight different intervals in each subplot:
# same intervals in all subplots, in orange
pp.view(eyedata, highlight=blinks, highlight_color="orange")

# or per subplot
pp.view(eyedata, highlight={"pupil": blinks})
highlight is either a single Intervals object (shown in all subplots) or a dict mapping subplot keys to Intervals. The keys are 'pupil', 'x', 'y' and 'extra_<label>' for extra_plots (EyeData), or the plot labels (arrays). Intervals in time units are converted to seconds, sample-index Intervals are placed using the time vector.
Interactive Selection#
The viewer supports interactive region selection:
Press
Sto enter selection modeClick and drag to select a region
Press
DorBackspaceto remove the last selectionWhen you close the viewer, selected regions are returned as
Intervalsobjects
import pypillometry as pp

eyedata = pp.get_example_data("rlmw_002_short")

# View data and select regions
selections = pp.view(eyedata, variables=['pupil'])

# selections is a dict of Intervals if any regions were selected
if selections:
    print(selections)
The returned dict has the same keys as highlight ('pupil', 'x', 'y', 'extra_<label>' or the plot labels for arrays). The Intervals are in seconds (units='sec'); for raw arrays without time they are sample indices (units="samples"). If no region was selected, view() returns None.
API reference#
All parameters are documented in the API reference: view().