
CircularROI#
- class pypillometry.CircularROI(center, radius, name=None, setup=None)[source]#
Bases:
ROICircular Region of Interest defined by center point and radius.
Coordinates are in pixels (origin at upper-left, y increases downward) by default. Use from_mm() or from_degrees() factory methods for alternative coordinate systems.
- Parameters:
- Raises:
ValueError – If radius is negative
Examples
>>> import numpy as np
>>> from pypillometry import CircularROI
>>> roi = CircularROI(center=(640, 512), radius=100, name="center")
>>> bool((650, 500) in roi)
True
>>> roi.contains(np.array([[640, 512], [900, 900]]))
array([ True, False])
Methods
Test if coordinates are within the circle (boundary included).
Create circular ROI from visual angle coordinates.
Create circular ROI from mm coordinates (origin at screen center).
Plot the circular ROI.
Details
- classmethod from_degrees(center, radius, setup, name=None)[source]#
Create circular ROI from visual angle coordinates.
- Parameters:
center (
Tuple[Union[float,str],Union[float,str]]) – (x, y) center in visual angle from screen center. Positive x = right, positive y = up. Each coordinate can be: - float: degrees - str: with units, e.g., “5 deg”, “0.087 rad” - with a unit, e.g., 5 * u.degradius (
Union[float,str]) – Radius in visual angle. Can be: - float: degrees - str: with units, e.g., “2 deg”, “0.035 rad” - with a unit, e.g., 5 * u.degsetup (
ExperimentalSetup) – Experimental setup with screen geometry and eye distance (screen_resolution, physical_screen_size, and eye_to_screen_center must be set)name (
str) – Name of the ROI
- Return type:
- Returns:
ROI with coordinates converted to pixels
Examples
>>> from pypillometry import ExperimentalSetup, CircularROI
>>> setup = ExperimentalSetup(
...     screen_resolution=(1920, 1080),
...     physical_screen_size=("52 cm", "29 cm"),
...     eye_to_screen_center="60 cm"
... )
>>> roi = CircularROI.from_degrees(center=("5 deg", "2.5 deg"), radius="2 deg", setup=setup)
>>> roi = CircularROI.from_degrees(center=(5, 2.5), radius=2, setup=setup)  # degrees
- classmethod from_mm(center_mm, radius_mm, setup, name=None)[source]#
Create circular ROI from mm coordinates (origin at screen center).
- Parameters:
center_mm (
Tuple[float,float]) – (x, y) center in mm relative to screen center. Positive x = right, positive y = up.radius_mm (
float) – Radius in mmsetup (
ExperimentalSetup) – Experimental setup with screen geometry (screen_resolution and physical_screen_size must be set)name (
str) – Name of the ROI
- Return type:
- Returns:
ROI with coordinates converted to pixels
Examples
>>> from pypillometry import ExperimentalSetup, CircularROI
>>> setup = ExperimentalSetup(
...     screen_resolution=(1920, 1080),
...     physical_screen_size=("52 cm", "29 cm")
... )
>>> roi = CircularROI.from_mm(center_mm=(50, 25), radius_mm=30, setup=setup)
- plot(ax=None, **kwargs)[source]#
Plot the circular ROI.
- Parameters:
ax (matplotlib.axes.Axes, optional) – The axes to plot on. If None, the current axes will be used.
**kwargs (dict) – Additional keyword arguments passed to patches.Circle. Common options include: - facecolor: color of the circle fill - edgecolor: color of the circle edge - alpha: transparency - fill: whether to fill the circle - label: label for the legend
- Return type:
- Returns:
the axes of the plot (the circle is
ax.patches[-1])
Examples
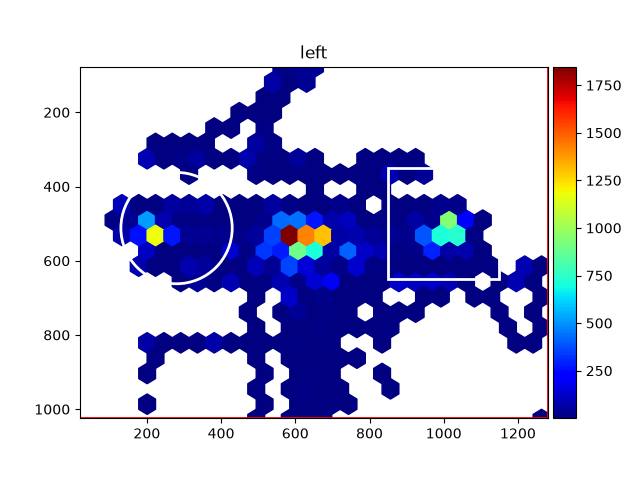
Draw two regions on a gaze heatmap:
>>> import pypillometry as pp
>>> from pypillometry import u
>>> import matplotlib.pyplot as plt
>>> d = pp.get_example_data("rlmw_002_short")
>>> left = pp.CircularROI((280, 512), radius=150, name="left stimulus")
>>> right = pp.RectangularROI((850, 350), (1150, 650), name="right stimulus")
>>> fig = d.plot.plot_heatmap(eyes="left")
>>> ax = fig.axes[0]  # the heatmap (axes[1] is the colorbar)
>>> ax = left.plot(ax=ax, edgecolor="white", linewidth=2, alpha=1)
>>> ax = right.plot(ax=ax, edgecolor="white", linewidth=2, alpha=1)
d.plot.plot_heatmap()andd.plot.plot_scanpath()can also draw them (rois=[left, right]).