
SegmentedEyeData#
- class pypillometry.SegmentedEyeData(name, tx, data, epochs=None, sampling_rate=None, valid_share=None)[source]#
Bases:
VersionedStateSegments of eye data around events (e.g., event-related pupil dilation).
Holds equal-length segments of one or several channels (e.g.,
"left_pupil","left_x"and"left_y"), each a masked array of shape (time points, segments), together with the epochs they were cut from (event onsets, window, labels and metadata; once for all channels), the time axis and the sampling rate. The mask marks missing or unusable samples.Usually created with
get_segments()from theEpochsreturned byget_epochs(), e.g.,d.get_segments(d.get_epochs("F", window=(-200, 800) * u.ms)).A channel is read with
seg["left_pupil"]and set withseg["left_pupil"] = values. The methods of the object work on all channels: selecting trials (keep(),filter()) and channels (select_channels(),drop_channels()), the plot of mean and error over time (plot()) and saving (write_file()). The methods for one kind of data are in namespaces, as forEyeData:seg.pupil(SegmentedPupilNamespace): baseline correction and the plot of the event-related pupil dilationseg.gaze(SegmentedGazeNamespace): regions of interest (where the gaze is in an ROI, fixation curves, dwell time and first entry per trial)
Averages. A column of the segments is a single trial or an average of trials:
average()averages all trials or groups of them (e.g., by condition),concat_segments()stacks the segments of several participants (with the metadata column"subject") andgroup_segments()averages them per participant. Averages are segments like the others; their epochs have no time (NaN onsets) and their metadata are the grouping columns, the columns that were the same in all their trials, and the number of trials ("n_trials"). An average is masked where all its trials are masked; valid_share holds the share of its trials that were usable at each time point (used for the missing data inplot()).- Parameters:
name (
str) – name of the segments (e.g., “cue-locked”)tx (
ndarray) – time axis relative to the event onsets in ms (one value per time point)data (
dict) – channel name ("<eye>_<variable>", e.g.,"left_pupil") -> array of shape (time points, segments); arrays that are not masked arrays are masked where they are NaNepochs (Epochs, optional) – the epochs the segments were cut from (one per segment); segments from old files made from intervals that were not event-locked keep these Intervals
sampling_rate (
float) – sampling rate in Hzvalid_share (
dict) – channel name -> share (0 to 1) of the trials of each value that are usable, an array of the shape of the channel (for averages; created byaverage()); channels that are not in it have 1 where they are not masked and 0 where they are
- Raises:
ValueError – if there are no channels, a channel name does not have the form
"<eye>_<variable>", or the shapes of the channels, the time axis, the epochs and valid_share do not match
Examples
>>> import pypillometry as pp
>>> from pypillometry import u
>>> d = pp.get_example_data("rlmw_002_short")
>>> seg = d.get_segments(d.get_epochs("S_", (-500, 2500) * u.ms))
>>> seg.channels
['left_x', 'left_y', 'left_pupil', 'right_x', 'right_y', 'right_pupil']
>>> seg["left_pupil"].shape  # (time points, segments)
(1500, 10)
>>> seg = seg.pupil.baseline_correct((-200, 0))
>>> seg.average()["left_pupil"].shape  # (time points, averages)
(1500, 1)
Methods
Average the segments: all trials, or the trials of each group.
New segments without the given channels.
New segments with the trials whose epochs match the criteria.
Cut segments of one or several channels from an EyeData object.
Read a SegmentedEyeData object from a pickle or HDF5 file.
New segments with the trials where mask is True (in all channels).
Plot mean and error ribbon over time, one line per channel.
Plot all segments of one channel as an image ("carpet plot").
New segments with some of the channels.
Return a summary of the segments.
Save to file (see
write_file()).Details
- gaze#
alias of
SegmentedGazeNamespace
- pupil#
alias of
SegmentedPupilNamespace
- classmethod from_eyedata(eyedata, epochs, channels=None, name=None, policy='default', eyes=[], variables=[])[source]#
Cut segments of one or several channels from an EyeData object.
- Parameters:
eyedata (EyeData) – source eye data object
epochs (Epochs or Intervals) – the segments to extract; for Epochs (e.g., from
get_epochs()), the length and the time axis (window[0] + arange(n) * 1000/fsms) come from the window, and the parts outside the data are masked. Intervals must all have the same length; they are used as Epochs with the onsets at their starts and the window(0, length)(kept as epochs of the result)channels (str or list of str, optional) – channels to extract (e.g.,
"left_pupil"); if None, those of eyes and variablesname (
str) – name of the segments; if None, the label of epochs or “segments”policy (str, MaskPolicy or list of str) – mask policy of the segments: the samples that are unusable under it are masked (see
mask()); default"default"(interpolated samples are used)eyes (str or list of str, optional) – eyes to extract if channels is None (default: all)
variables (str or list of str, optional) – variables to extract if channels is None (e.g.,
"pupil"; default: all)
- Return type:
- Returns:
new instance with extracted segments
- classmethod from_file(fname, **kwargs)[source]#
Read a SegmentedEyeData object from a pickle or HDF5 file.
- Parameters:
fname (
str) – Filename (or HTTP(S)/SSH URL) to read from**kwargs – passed to
read_file()(e.g., cache_file, cache_dir, cache_layout, autodelete, session)
- Return type:
- Returns:
Loaded instance
- average(by=None, meanfct=<function mean>, name=None)[source]#
Average the segments: all trials, or the trials of each group.
The groups are the combinations of the values of the metadata columns by (e.g.,
by="cond"orby=["subject", "cond"]), in the order in which they first occur. The result has one column per group, withEpochswithout a time (NaN onsets) whose metadata are the by columns, the other columns that have the same value in all trials of each group, and the number of trials ("n_trials"). Its label is the label of the trials if they all have the same, otherwise the values of by (joined with “/”).Averaging segments that are averages themselves (e.g., participant means, see
group_segments()) gives each of them the same weight. An average is masked where all its trials are masked; its share of usable trials (valid_share) is kept for the missing data inplot().- Parameters:
by (str or list of str, optional) – metadata columns of the epochs that define the groups;
"label"uses the event labels (if there is no metadata column of this name); default: one average of all trialsmeanfct (callable) – function that averages the trials, called as
meanfct(data,
axis=1)
; it must accept an axis argument and ignore masked values (e.g., np.mean or np.ma.median, but not np.median; a warning is logged otherwise)name (
str) – name of the result (default: the name of the segments)
- Return type:
- Returns:
the averages (one column per group), with all channels
- Raises:
KeyError – if a column of by is not in the metadata of the epochs
Examples
>>> import pypillometry as pp
>>> from pypillometry import u
>>> d = pp.get_example_data("rlmw_002_short")
>>> ep = d.get_epochs("S_", (-500, 2500) * u.ms)
>>> ep = ep.set_meta("half", np.where(np.arange(len(ep)) < 5, "first", "second"))
>>> avg = d.get_segments(ep).average(by="half")
>>> avg["left_pupil"].shape  # (time points, groups)
(1500, 2)
>>> {k: v.tolist() for k, v in avg.epochs.meta.items()}
{'half': ['first', 'second'], 'n_trials': [5, 5]}
- drop_channels(*channels)[source]#
New segments without the given channels.
- Parameters:
*channels (
str) – channel names (e.g.,"left_x")- Return type:
- Returns:
new object with the other channels
- Raises:
KeyError – if a channel does not exist
ValueError – if no channel would be left
- filter(selector=None, exact=False, **conditions)[source]#
New segments with the trials whose epochs match the criteria.
The epochs are selected as with
Epochs.filter: by event label, onset time (in ms), a boolean array or metadata. All channels keep the same trials.- Parameters:
selector (str, callable, tuple or boolean array, optional) – criterion for the events (see
Events.filter)exact (
bool) – if True, a string selector matches only labels equal to it**conditions – criteria for metadata columns, e.g.
cond="easy",trial=[1, 2]orrt=lambda rt: rt < 800
- Return type:
- Returns:
new object with the selected segments (and their epochs)
- Raises:
ValueError – if the segments have no Epochs (e.g., from old files)
Examples
>>> import pypillometry as pp
>>> from pypillometry import u
>>> d = pp.get_example_data("rlmw_002_short")
>>> ep = d.get_epochs("S_", (-500, 2500) * u.ms)
>>> ep = ep.set_meta("half", np.where(np.arange(len(ep)) < 5, "first", "second"))
>>> seg = d.get_segments(ep)
>>> seg.filter(half="first").n_segments
5
- keep(mask)[source]#
New segments with the trials where mask is True (in all channels).
- Parameters:
mask (array-like of bool) – one value per segment, e.g.,
seg.epochs.meta["rt"] < 800- Return type:
- Returns:
new object with the selected segments (and their epochs)
- Raises:
ValueError – if mask is not a boolean array with one value per segment
Examples
>>> import pypillometry as pp
>>> from pypillometry import u
>>> d = pp.get_example_data("rlmw_002_short")
>>> seg = d.get_segments(d.get_epochs("S_", (-500, 2500) * u.ms))
>>> # reject trials with more than half of the left pupil missing
>>> ok = seg["left_pupil"].mask.mean(axis=0) < 0.5
>>> bool(seg.keep(ok).n_segments == ok.sum())
True
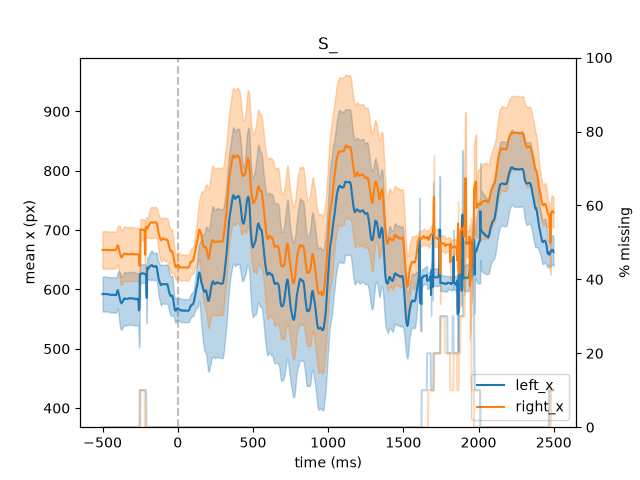
- plot(channels=None, meanfct=<function mean>, varfct=<function sem>, show_missing=None, show_zero_line=True, show_legend=None, title=None, label=None, ylabel=None, ribbon_alpha=0.3, ax=None, **kwargs)[source]#
Plot mean and error ribbon over time, one line per channel.
Can be used standalone for a quick look, or with ax parameter to overlay multiple segments on the same plot or across subplots.
seg.pupil.plot()plots the pupil channels,seg.gaze.plot_roi()the share of trials in a region of interest.- Parameters:
channels (str or list of str, optional) – channels to plot; default: all (only if they are all of the same variable, e.g., pupil of both eyes)
meanfct (callable) – Function to compute mean across segments (default: np.mean)
varfct (callable or None) – Function to compute error bands (e.g., np.std, scipy.stats.sem) If None, no error bands are plotted. Both functions are called as
fct(data, axis=1), so they must accept an axis argument, and they must ignore masked values (e.g., np.ma.median, not np.median; a warning is logged otherwise).show_missing (
bool) – Plot percentage of missing data per time point on secondary y-axis. If None, defaults to True in standalone mode, False in overlay mode.show_zero_line (
bool) – Show vertical line at time 0 (default: True)show_legend (
bool) – Show legend. If None, only shows legend in standalone mode (ax=None)title (
str) – Plot title. If None and ax is None, uses the dataset name. Ignored when ax is provided (for overlay use).label (
str) – Label for legend. If None, the name of the segments (one channel) or the channel names (several channels; with label, they are added to it)ylabel (
str) – label of the y-axis in standalone mode (default: “mean” and the variable)ribbon_alpha (
float) – Alpha (transparency) for error ribbon (default: 0.3)ax (matplotlib.axes.Axes, optional) – Axes to plot on. If None, uses current axes (standalone mode)
**kwargs (dict) – Additional arguments passed to ax.plot() (e.g., color, linestyle, linewidth)
- Returns:
ax (matplotlib.axes.Axes) – The axes object for further customization
- Raises:
ValueError – if channels is None and the channels are of several variables
Examples
>>> import pypillometry as pp
>>> from pypillometry import u
>>> d = pp.get_example_data("rlmw_002_short")
>>> seg = d.get_segments(d.get_epochs("S_", (-500, 2500) * u.ms))
>>> ax = seg.plot(["left_x", "right_x"], ylabel="mean x (px)")
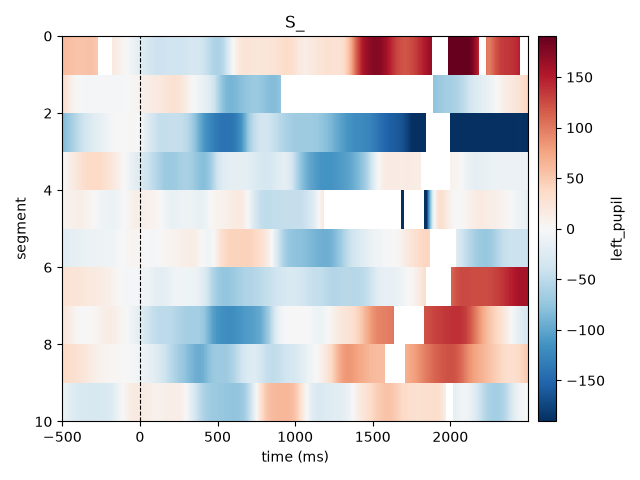
- plot_carpet(channel=None, sort_by=None, cmap=None, vmin=None, vmax=None, center=None, show_zero_line=True, colorbar=True, show_mean=False, title=None, ax=None, **kwargs)[source]#
Plot all segments of one channel as an image (“carpet plot”).
Each row is one segment (e.g., a trial), the x-axis is the time relative to the event, and the color is the value. Masked samples are left empty (white). Unlike the mean in
plot(), this shows how the response varies between trials, e.g., trials with artifacts or a change over the session; sorting the rows by a property of the trials (sort_by, e.g., the reaction time) shows how the response depends on it.- Parameters:
channel (
str) – channel to plot (e.g.,"left_pupil"); default: the only channel of the segmentssort_by (str or array-like, optional) – order of the rows: a metadata column of the epochs (e.g.,
"rt") or one value per segment; the rows are sorted by it in ascending order (from the top), ties keep their order; default: the order of the segmentscmap (
str) – colormap; default"RdBu_r"if the color scale is centered at 0,"viridis"otherwisevmin (
float) – limits of the color scale; default: the 2nd and 98th percentile of the usable values (so that a few extreme values do not set the scale), symmetric around 0 if centervmax (
float) – limits of the color scale; default: the 2nd and 98th percentile of the usable values (so that a few extreme values do not set the scale), symmetric around 0 if centercenter (
bool) – center the color scale at 0 (e.g., for baseline-corrected data, so that increases and decreases have different colors); default (None): if the values have both signsshow_zero_line (
bool) – draw a vertical line at the event onset (time 0); default Truecolorbar (
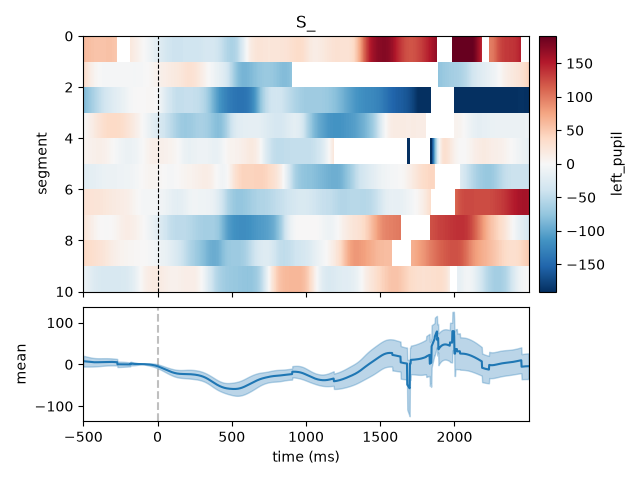
bool) – add a colorbar (labelled with the channel); default Trueshow_mean (
bool) – show the mean over the segments with its standard error below the image, on the same time axis (asplot()); default Falsetitle (
str) – title; default: the name of the segments if ax is None, none otherwiseax (matplotlib.axes.Axes, optional) – axes to plot into; default: the current axes
**kwargs – passed to
matplotlib.axes.Axes.imshow()
- Returns:
ax (matplotlib.axes.Axes) – the axes of the image; with show_mean, a tuple
(ax,
ax_mean)
with the axes of the mean as well- Raises:
ValueError – if channel is None and the segments have several channels, or sort_by does not have one value per segment
KeyError – if the channel or the metadata column does not exist
Examples
>>> import pypillometry as pp
>>> from pypillometry import u
>>> d = pp.get_example_data("rlmw_002_short")
>>> d = d | pp.pupil.blinks_detect() | pp.pupil.lowpass_filter(5)
>>> seg = d.get_segments(d.get_epochs("S_", (-500, 2500) * u.ms), "left_pupil")
>>> seg = seg.pupil.baseline_correct((-200, 0))
>>> ax = seg.plot_carpet()
With the mean below the image:
>>> import pypillometry as pp
>>> from pypillometry import u
>>> d = pp.get_example_data("rlmw_002_short")
>>> d = d | pp.pupil.blinks_detect() | pp.pupil.lowpass_filter(5)
>>> seg = d.get_segments(d.get_epochs("S_", (-500, 2500) * u.ms), "left_pupil")
>>> seg = seg.pupil.baseline_correct((-200, 0))
>>> ax, ax_mean = seg.plot_carpet(show_mean=True)
- select_channels(channels=None, eyes=[], variables=[])[source]#
New segments with some of the channels.
- Parameters:
- Return type:
- Returns:
new object with the selected channels (and the same epochs)
- Raises:
KeyError – if a channel, eye or variable does not exist
Examples
>>> import pypillometry as pp
>>> from pypillometry import u
>>> d = pp.get_example_data("rlmw_002_short")
>>> seg = d.get_segments(d.get_epochs("S_", (-500, 2500) * u.ms))
>>> seg.select_channels(variables=["x", "y"], eyes="left").channels
['left_x', 'left_y']
- summary()[source]#
Return a summary of the segments.
- Return type:
- Returns:
name, channels, n_segments, n_timepoints, window, percent_masked (dict: channel -> percentage of missing values; for averages, of missing trials), sampling_rate, n_averages (the number of columns that are averages) and n_trials (the number of trials in all columns; None if not known)
- write_file(fname, compress=True)[source]#
Save to file (see
write_file()).The format follows from the extension: HDF5 for
.h5and.hdf5, pickle otherwise.