plot_prf#
- pypillometry.signal.plot_prf(npar=10.1, tmax=930, max_duration='estimate', fs=500, title=None, ax=None, **kwargs)[source]#
Plot profile of the pupil-response function (PRF) with parameters npar and tmax.
- Parameters:
npar (float) – PRF parameter \(n\), see
pupil_kernel()tmax (float) – PRF parameter \(t_{max}\) in ms, see
pupil_kernel()max_duration (float or "estimate") – length of the plotted time window in ms; “estimate” uses
pupil_get_max_duration()fs (float) – sampling rate in Hz used to evaluate the PRF
title (str, optional) – title of the plot
ax (matplotlib.axes.Axes, optional) – axes to plot on; default: the current axes
**kwargs – passed on to
matplotlib.axes.Axes.plot()
- Return type:
- Returns:
the axes of the plot
Examples
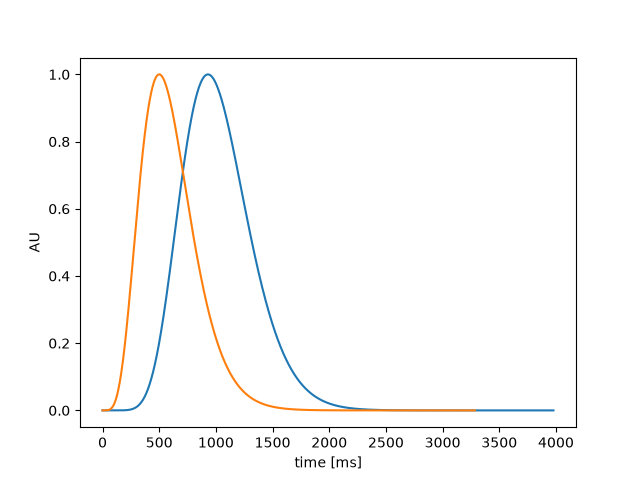
The default response function and one that peaks earlier:
>>> import pypillometry as pp
>>> import matplotlib.pyplot as plt
>>> fig, ax = plt.subplots()
>>> ax = pp.signal.plot_prf(ax=ax)
>>> ax = pp.signal.plot_prf(npar=5, tmax=500, ax=ax)