

Events#
Events are time points marked during a recording, usually triggers that the experiment software sends to the eye tracker (e.g., “stimulus on”, “response”). Each event has an onset time and a label. This tutorial shows how to look at events, select the ones you need and change them, using the Events class.
[1]:
import pypillometry as pp
from pypillometry import u
import numpy as np
import matplotlib.pyplot as plt

pp.logging_set_level("WARNING")

d = pp.get_example_data("rlmw_002_short")
Getting the events#
d.events holds the events of a dataset as an Events object. In a notebook, it is shown as a table:
[2]:
events = d.events
events
[2]:
| Onset (ms) | Label | |
|---|---|---|
| 0 | 5177.0 | F_1 |
| 1 | 5677.0 | S_1_1_5 |
| 2 | 6773.0 | C_1_5_2 |
| 3 | 7010.0 | R_1_15 |
| 4 | 8776.0 | F_2 |
| 5 | 9575.0 | S_2_6_2 |
| 6 | 10581.0 | C_2_6_1 |
| 7 | 10808.0 | R_2_20 |
| 8 | 12374.0 | F_3 |
| 9 | 12574.0 | S_3_2_1 |
| 10 | 13733.0 | C_3_2_1 |
| 11 | 13957.0 | R_3_18 |
| 12 | 15973.0 | F_4 |
| 13 | 16473.0 | S_4_4_1 |
| 14 | 17589.0 | C_4_1_2 |
| 15 | 17822.0 | R_4_11 |
| 16 | 19588.0 | F_5 |
| 17 | 20388.0 | S_5_3_5 |
| 18 | 21156.0 | C_5_5_2 |
| 19 | 21388.0 | R_5_17 |
| 20 | 23187.0 | F_6 |
| 21 | 23987.0 | S_6_4_5 |
| 22 | 24916.0 | C_6_5_2 |
| 23 | 25153.0 | R_6_20 |
| 24 | 26802.0 | F_7 |
| 25 | 27002.0 | S_7_3_1 |
| 26 | 28116.0 | C_7_1_2 |
| 27 | 28352.0 | R_7_6 |
| 28 | 30401.0 | F_8 |
| 29 | 30601.0 | S_8_6_5 |
| 30 | 31508.0 | C_8_6_1 |
| 31 | 31734.0 | R_8_18 |
| 32 | 34000.0 | F_9 |
| 33 | 34799.0 | S_9_4_6 |
| 34 | 35700.0 | C_9_6_2 |
| 35 | 35932.0 | R_9_19 |
| 36 | 37615.0 | F_10 |
| 37 | 38415.0 | S_10_2_5 |
| 38 | 39412.0 | C_10_5_2 |
| 39 | 39648.0 | R_10_18 |
Total: 40 events
The onsets are in ms. to_units() returns the events with the onsets in other units:
[3]:
d.events.to_units("sec")[:4]
[3]:
| Onset (sec) | Label | |
|---|---|---|
| 0 | 5.177 | F_1 |
| 1 | 5.677 | S_1_1_5 |
| 2 | 6.773 | C_1_5_2 |
| 3 | 7.010 | R_1_15 |
Total: 4 events
[4]:
events.to_units("min").onsets[:4]
[4]:
array([0.08628333, 0.09461667, 0.11288333, 0.11683333])
The onsets and labels are stored as numpy arrays. An Events object has a length and can be iterated over and indexed like a list. Indexing returns a new Events object:
[5]:
print(len(events))
for onset, label in events[:3]:
    print(f"{label:10s} at {onset:.0f} ms")
40
F_1        at 5177 ms
S_1_1_5    at 5677 ms
C_1_5_2    at 6773 ms
[6]:
events.onsets[:5], events.labels[:5]
[6]:
(array([5177., 5677., 6773., 7010., 8776.]),
 array(['F_1', 'S_1_1_5', 'C_1_5_2', 'R_1_15', 'F_2'], dtype='<U8'))
Selecting events#
filter() returns the events that match a criterion. There are three kinds of criteria.
A string selects all labels that contain it:
[7]:
events.filter("S_")
[7]:
| Onset (ms) | Label | |
|---|---|---|
| 0 | 5677.0 | S_1_1_5 |
| 1 | 9575.0 | S_2_6_2 |
| 2 | 12574.0 | S_3_2_1 |
| 3 | 16473.0 | S_4_4_1 |
| 4 | 20388.0 | S_5_3_5 |
| 5 | 23987.0 | S_6_4_5 |
| 6 | 27002.0 | S_7_3_1 |
| 7 | 30601.0 | S_8_6_5 |
| 8 | 34799.0 | S_9_4_6 |
| 9 | 38415.0 | S_10_2_5 |
Total: 10 events
A function is called with each label and selects the events for which it returns True. In this dataset, the labels of the R events end with a number; here we select those where it is larger than 18:
[8]:
def high_number(label):
    parts = label.split("_")
    return parts[0] == "R" and int(parts[-1]) > 18

events.filter(high_number)
[8]:
| Onset (ms) | Label | |
|---|---|---|
| 0 | 10808.0 | R_2_20 |
| 1 | 25153.0 | R_6_20 |
| 2 | 35932.0 | R_9_19 |
Total: 3 events
A tuple (start, end) selects events by their onset, in the units of the Events object (here, ms):
[9]:
events.filter((10_000, 20_000))
[9]:
| Onset (ms) | Label | |
|---|---|---|
| 0 | 10581.0 | C_2_6_1 |
| 1 | 10808.0 | R_2_20 |
| 2 | 12374.0 | F_3 |
| 3 | 12574.0 | S_3_2_1 |
| 4 | 13733.0 | C_3_2_1 |
| 5 | 13957.0 | R_3_18 |
| 6 | 15973.0 | F_4 |
| 7 | 16473.0 | S_4_4_1 |
| 8 | 17589.0 | C_4_1_2 |
| 9 | 17822.0 | R_4_11 |
| 10 | 19588.0 | F_5 |
Total: 11 events
Since filter() returns a new Events object, filters can be chained, e.g., the S events in the first 20 seconds:
[10]:
events.filter("S_").filter((0, 20_000))
[10]:
| Onset (ms) | Label | |
|---|---|---|
| 0 | 5677.0 | S_1_1_5 |
| 1 | 9575.0 | S_2_6_2 |
| 2 | 12574.0 | S_3_2_1 |
| 3 | 16473.0 | S_4_4_1 |
Total: 4 events
test_selector() shows which events of a dataset a selector picks out, which is useful while writing a selection function:
[11]:
from pypillometry.convenience import test_selector
test_selector(d, high_number)
[11]:
array(['R_2_20', 'R_6_20', 'R_9_19'], dtype='<U8')
Plotting events#
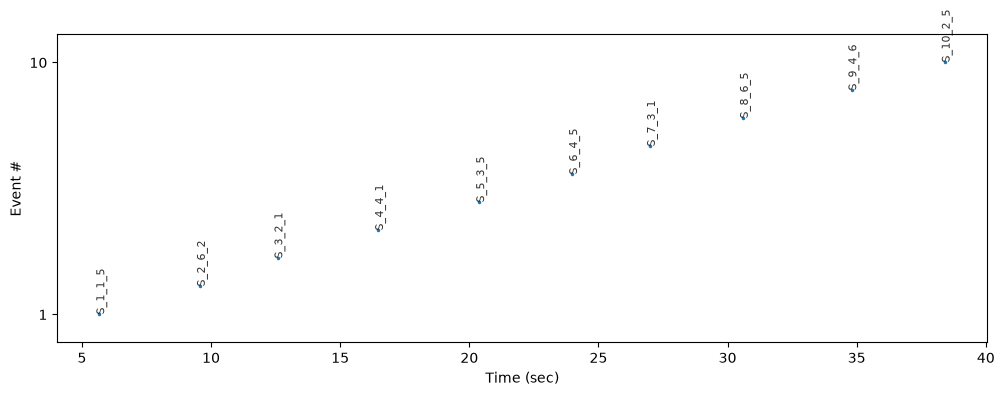
plot() shows when the events happened. Each event is a point; the labels of some of them are shown (use show_labels="all" for all):
[12]:
plt.figure(figsize=(12, 4))
events.filter("S_").plot(units="sec", show_labels="all");
Events are also shown in most plots of the data, e.g., in d.plot.plot_pupil().
Using events for intervals#
Analyses usually look at the data around events. get_epochs() takes the same kinds of selectors as filter() (string or function), and also an Events object. This makes it easy to use any selection of events, e.g., only the first five stimuli:
[13]:
first_stimuli = events.filter("S_")[:5]
d.get_epochs(first_stimuli, (-200, 800) * u.ms)
[13]:
Epochs 'events_5' | 5 epochs, window (-200, 800) ms
See the Intervals tutorial for more on intervals.
Creating and changing events#
Events objects can also be created directly. Onsets with units are converted, and the object keeps the units:
[14]:
my_events = pp.Events([1, 2.5, 4] * u.sec, ["start", "probe", "end"])
my_events
[14]:
| Onset (sec) | Label | |
|---|---|---|
| 0 | 1.0 | start |
| 1 | 2.5 | probe |
| 2 | 4.0 | end |
Total: 3 events
Events cannot be changed in place; set_events() replaces the events of a dataset with new ones. For example, we can shorten the labels to just the event type (the first letter). The onsets stay the same:
[15]:
short_labels = [label.split("_")[0] for label in events.labels]
d.set_events(pp.Events(events.onsets, short_labels))
d.events[:6]
[15]:
| Onset (ms) | Label | |
|---|---|---|
| 0 | 5177.0 | F |
| 1 | 5677.0 | S |
| 2 | 6773.0 | C |
| 3 | 7010.0 | R |
| 4 | 8776.0 | F |
| 5 | 9575.0 | S |
Total: 6 events
Like the other set_* methods, set_events() always changes the object in place; use d.copy().set_events(...) to keep the original.
As another example, we add the onset of each blink as an event. Blinks are stored as Intervals (see the blinks tutorial); we take their start times in ms, combine them with the existing events and sort everything by time:
[16]:
d.pupil.blinks_detect()
blinks = d.get_blinks("left", "pupil", units="ms")["left_pupil"]
blink_onsets = [start for start, end in blinks]

events = d.events
onsets = np.concatenate([events.onsets, blink_onsets])
labels = np.concatenate([events.labels, ["blink"] * len(blink_onsets)])
order = np.argsort(onsets)
d.set_events(pp.Events(onsets[order], labels[order]))

d.events[:12]
[16]:
| Onset (ms) | Label | |
|---|---|---|
| 0 | 5177.0 | F |
| 1 | 5408.0 | blink |
| 2 | 5677.0 | S |
| 3 | 6773.0 | C |
| 4 | 7010.0 | R |
| 5 | 7562.0 | blink |
| 6 | 7864.0 | blink |
| 7 | 8130.0 | blink |
| 8 | 8776.0 | F |
| 9 | 9575.0 | S |
| 10 | 10484.0 | blink |
| 11 | 10581.0 | C |
Total: 12 events
The blink onsets can now be used like any other event, e.g., to look at the pupil around blinks with d.get_epochs("blink", ...).
Metadata#
Events can also carry more information, such as the trial, the condition or the reaction time, decomposed from the labels or taken from a behaviour log. Events can then be selected by it, e.g., events.filter("S_", cond="easy"). See the event metadata tutorial.