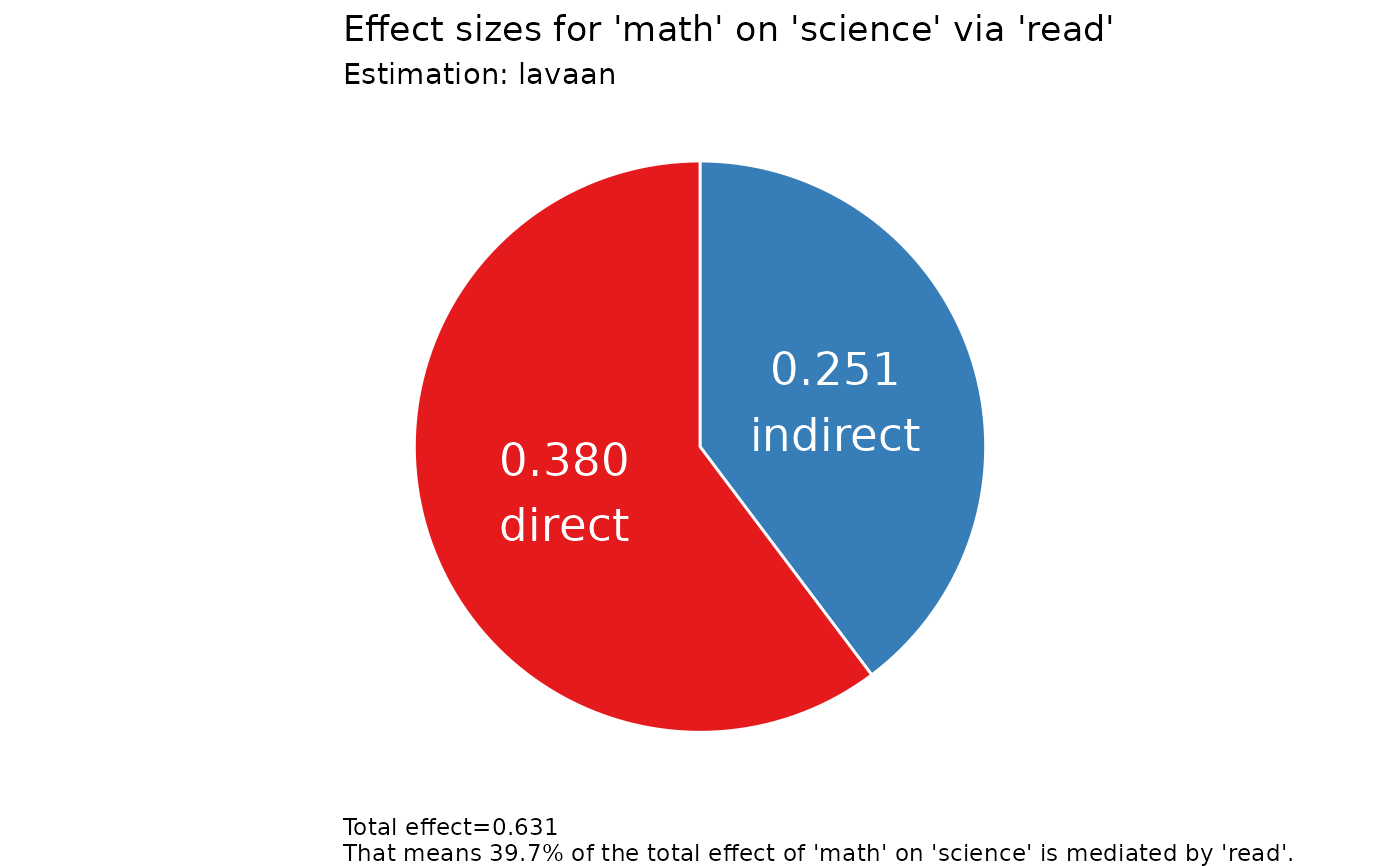
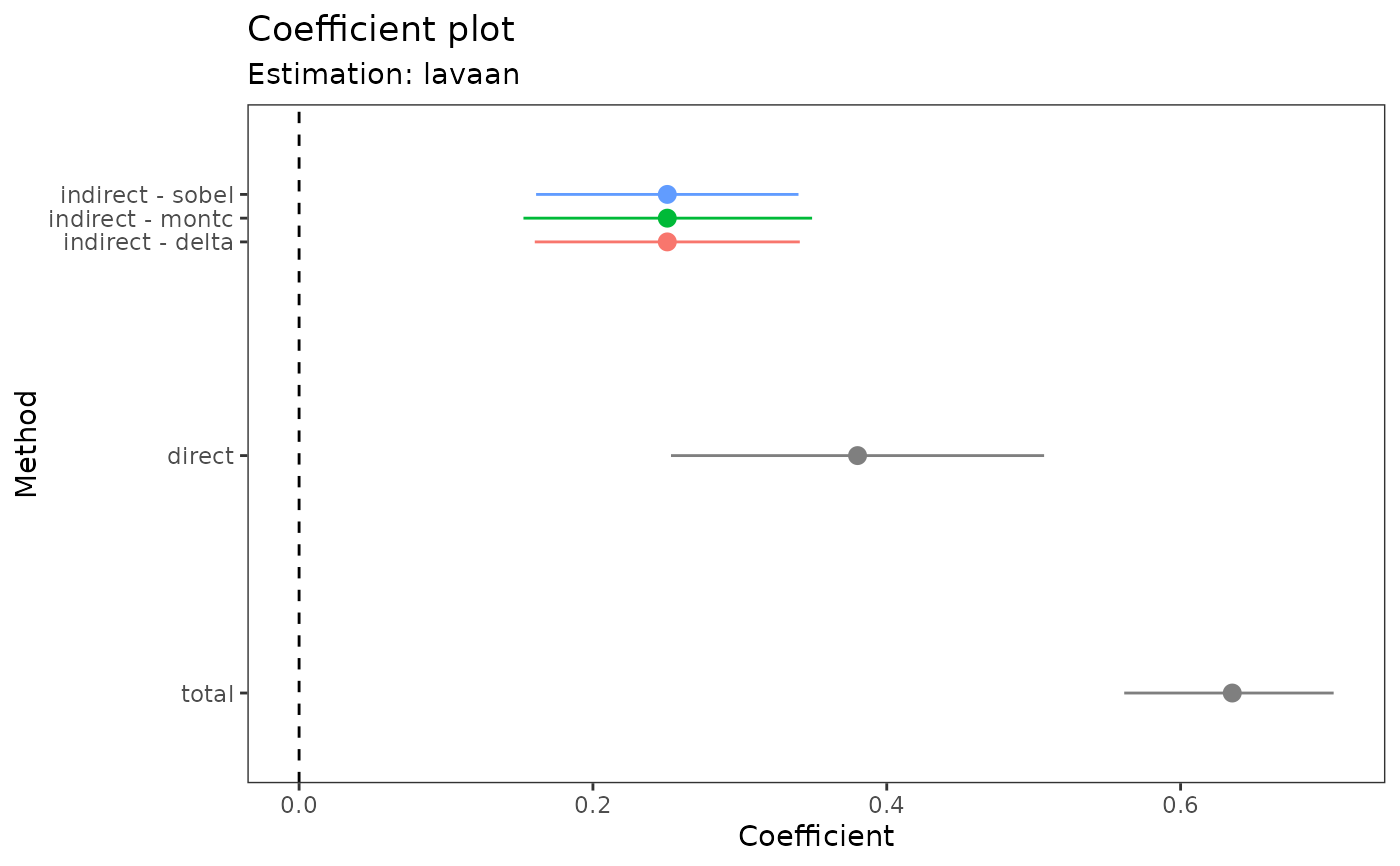
Creates a visualization of the mediation analysis results. By default,
produces a coefficient plot. Use type = "effect" for an effect size
pie chart.
Usage
# S3 method for class 'rmedsem'
plot(x, type = c("coef", "effect"), ...)
Arguments
- x
the rmedsem object
- type
character; either "coef" (default) for a coefficient plot or
"effect" for an effect size plot
- ...
additional arguments passed to plot_coef() or plot_effect()
Examples
mod.txt <- "
read ~ math
science ~ read + math
"
mod <- lavaan::sem(mod.txt, data=rmedsem::hsbdemo)
out <- rmedsem(mod, indep="math", med="read", dep="science")
plot(out)
#> Warning: `position_dodge()` requires non-overlapping x intervals.

plot(out, type="effect")