Interactive version:
Importing Data Example
In order to import data into pypillometry, we have to load the data from the source using other packages and then wrap it into PupilData objects.
Here we will show and example where we translate a file recorded in Eyelinks EDF-format to a file readable by pandas.read_table().
First, we import the needed modules.
[2]:
import sys, os
sys.path.insert(0,"..") # this is not needed if you have installed pypillometry
import pypillometry as pp
import pandas as pd
import numpy as np
import pylab as plt
In this example, we use data recorded with an Eyelink-eyetracker. These eyetrackers store the files in binary files with the extension .edf. Some information about this file-format is here. We use a command-line utility released by Eyelink to convert this proprietory format into a more easily read .asc file that is a whitespace-separated plain-text format. The converter, edf2asc is a program that can be downloaded for different
platforms from the Eyelink support forum. There is a GUI-based program for windows and command-line programs for linux and mac. Binaries of the command-line tools for linux and mac are included in pypillometry under this link.
On linux, we would call these programs on an example edf-file twice as follows.
[1]:
!../external/edf2asc-mac -y -s ../data/test.edf ../data/test_samples.asc
!../external/edf2asc-mac -y -e ../data/test.edf ../data/test_events.asc
EDF2ASC: EyeLink EDF file -> ASCII (text) file translator
EDF2ASC version 3.1 MacOS X Jul 13 2010
(c)1995-2009 by SR Research, last modified Jul 13 2010

processing file ../data/test.edf
=======================Preamble of file ../data/test.edf=======================
| DATE: Fri Feb 14 08:48:33 2020                                              |
| TYPE: EDF_FILE BINARY EVENT SAMPLE TAGGED                                   |
| VERSION: EYELINK II 1                                                       |
| SOURCE: EYELINK CL                                                          |
| EYELINK II CL v6.12 Feb  1 2018 (EyeLink Portable Duo)                      |
| CAMERA: EyeLink USBCAM Version 1.01                                         |
| SERIAL NUMBER: CLU-DAC49                                                    |
| CAMERA_CONFIG: DAC49200.SCD                                                 |
| Psychopy GC demo                                                            |
===============================================================================

Converted successfully: 0 events, 1245363 samples, 6 blocks.

EDF2ASC: EyeLink EDF file -> ASCII (text) file translator
EDF2ASC version 3.1 MacOS X Jul 13 2010
(c)1995-2009 by SR Research, last modified Jul 13 2010

processing file ../data/test.edf
=======================Preamble of file ../data/test.edf=======================
| DATE: Fri Feb 14 08:48:33 2020                                              |
| TYPE: EDF_FILE BINARY EVENT SAMPLE TAGGED                                   |
| VERSION: EYELINK II 1                                                       |
| SOURCE: EYELINK CL                                                          |
| EYELINK II CL v6.12 Feb  1 2018 (EyeLink Portable Duo)                      |
| CAMERA: EyeLink USBCAM Version 1.01                                         |
| SERIAL NUMBER: CLU-DAC49                                                    |
| CAMERA_CONFIG: DAC49200.SCD                                                 |
| Psychopy GC demo                                                            |
===============================================================================

Converted successfully: 36371 events, 0 samples, 6 blocks.
This results in two files, one containing all the samples and one all the recorded events.
[3]:
fname_samples="../data/test_samples.asc"
fname_events="../data/test_events.asc"
The samples-files contains a large table containing the timestamp, x/y-coordinates for the eyeposition and pupil-area for both the left and the right eye. Here are the first few rows of this file:
[4]:
!head $fname_samples
3385900   817.3   345.2  1707.0   860.6   375.2  1738.0 .....
3385902   817.0   343.5  1706.0   860.7   375.9  1739.0 .....
3385904   816.7   341.6  1705.0   861.2   376.6  1739.0 .....
3385906   816.7   340.4  1706.0   861.7   376.8  1740.0 .....
3385908   816.7   340.2  1707.0   861.6   376.9  1742.0 .....
3385910   816.8   340.2  1708.0   861.1   377.1  1743.0 .....
3385912   816.9   340.9  1708.0   860.7   377.5  1744.0 .....
3385914   816.1   342.1  1710.0   861.1   378.7  1745.0 .....
3385916   815.2   343.2  1712.0   862.5   380.0  1746.0 .....
3385918   814.4   343.6  1713.0   863.9   380.7  1747.0 .....
We can easily read this file using pandas.read_csv().
[5]:
df=pd.read_table(fname_samples, index_col=False,
                  names=["time", "left_x", "left_y", "left_p",
                         "right_x", "right_y", "right_p"])
df
[5]:
| time | left_x | left_y | left_p | right_x | right_y | right_p | |
|---|---|---|---|---|---|---|---|
| 0 | 3385900 | 817.3 | 345.2 | 1707.0 | 860.6 | 375.2 | 1738.0 |
| 1 | 3385902 | 817.0 | 343.5 | 1706.0 | 860.7 | 375.9 | 1739.0 |
| 2 | 3385904 | 816.7 | 341.6 | 1705.0 | 861.2 | 376.6 | 1739.0 |
| 3 | 3385906 | 816.7 | 340.4 | 1706.0 | 861.7 | 376.8 | 1740.0 |
| 4 | 3385908 | 816.7 | 340.2 | 1707.0 | 861.6 | 376.9 | 1742.0 |
| ... | ... | ... | ... | ... | ... | ... | ... |
| 1245358 | 5923060 | . | . | 0.0 | . | . | 0.0 |
| 1245359 | 5923062 | . | . | 0.0 | . | . | 0.0 |
| 1245360 | 5923064 | . | . | 0.0 | . | . | 0.0 |
| 1245361 | 5923066 | . | . | 0.0 | . | . | 0.0 |
| 1245362 | 5923068 | . | . | 0.0 | . | . | 0.0 |
1245363 rows × 7 columns
We can already use this information to create our PupilData-object. We simply pass in the pupil-area of the right eye (column right_p) and the timestamp-array from the samples-file (Note: we could just as easily have used the left eye or the mean of both):
[6]:
pp.PupilData(df.right_p, time=df.time, name="test")
> Filling in 5 gaps
[32.35   4.012  6.21   2.02   1.862] seconds
[6]:
PupilData(test, 135.5MiB):
 n                 : 1268585
 nmiss             : 212551
 perc_miss         : 16.75496714843704
 nevents           : 0
 nblinks           : 0
 ninterpolated     : 0
 blinks_per_min    : 0.0
 fs                : 500.0
 duration_minutes  : 42.28616666666667
 start_min         : 56.431666666666665
 end_min           : 98.7178
 baseline_estimated: False
 response_estimated: False
 History:
 *
Of course, this dataset is still missing the important information contained in the event-file which we will use for analysing trial-related pupil-diameter data. For that, we will have to read the events-file, which has a more complicated structure than the samples-file:
[7]:
!head -20 $fname_events
** CONVERTED FROM ../data/test.edf using edfapi 3.1 MacOS X Jul 13 2010 on Wed May 27 16:45:20 2020
** DATE: Fri Feb 14 08:48:33 2020
** TYPE: EDF_FILE BINARY EVENT SAMPLE TAGGED
** VERSION: EYELINK II 1
** SOURCE: EYELINK CL
** EYELINK II CL v6.12 Feb  1 2018 (EyeLink Portable Duo)
** CAMERA: EyeLink USBCAM Version 1.01
** SERIAL NUMBER: CLU-DAC49
** CAMERA_CONFIG: DAC49200.SCD
** Psychopy GC demo
**

INPUT   2767568 0
MSG     2784000 !CAL
>>>>>>> CALIBRATION (HV9,P-CR) FOR LEFT: <<<<<<<<<
MSG     2784000 !CAL Calibration points:
MSG     2784000 !CAL -29.4, -23.5        -0,     -2
MSG     2784000 !CAL -29.3, -35.7        -0,  -1544
MSG     2784000 !CAL -32.9, -10.4        -0,   1559
MSG     2784000 !CAL -49.7, -23.0     -2835,     -2
After a header (lines starting with ‘**’) containing meta-information, we get a sequence of “events” which have different formats for all rows. We are interested in lines starting with “MSG” because those contain our experimental markers. Therefore, we read the samples file and remove all rows that do not start with “MSG” first:
[8]:
# read the whole file into variable `events` (list with one entry per line)
with open(fname_events) as f:
    events=f.readlines()

# keep only lines starting with "MSG"
events=[ev for ev in events if ev.startswith("MSG")]
events[0:10]
[8]:
['MSG\t2784000 !CAL \n',
 'MSG\t2784000 !CAL Calibration points:  \n',
 'MSG\t2784000 !CAL -29.4, -23.5        -0,     -2   \n',
 'MSG\t2784000 !CAL -29.3, -35.7        -0,  -1544   \n',
 'MSG\t2784000 !CAL -32.9, -10.4        -0,   1559   \n',
 'MSG\t2784000 !CAL -49.7, -23.0     -2835,     -2   \n',
 'MSG\t2784000 !CAL -10.8, -27.4      2835,     -2   \n',
 'MSG\t2784000 !CAL -48.3, -33.3     -2818,  -1544   \n',
 'MSG\t2784000 !CAL -11.0, -34.2      2818,  -1544   \n',
 'MSG\t2784000 !CAL -56.2, -9.2     -2852,   1559   \n']
Next, we added an experimental marker that was sent as the experiment was started. This marker was called experiment_start. Hence, we can remove all events before this marker.
[9]:
experiment_start_index=np.where(["experiment_start" in ev for ev in events])[0][0]
events=events[experiment_start_index+1:]
events[0:10]
[9]:
['MSG\t3387245 C_GW_1_1_UD_UD\n',
 'MSG\t3390421 F_GW_1_1_10_0\n',
 'MSG\t3392759 C_NW_1_2_UD_UD\n',
 'MSG\t3394293 R_NW_1_2_UD_UD\n',
 'MSG\t3395952 F_NW_1_2_-1_0\n',
 'MSG\t3397974 C_NA_1_3_UD_UD\n',
 'MSG\t3399892 R_NA_1_3_UD_UD\n',
 'MSG\t3400999 F_NA_1_3_-11_0\n',
 'MSG\t3403206 C_GA_1_4_UD_UD\n',
 'MSG\t3404640 R_GA_1_4_UD_UD\n']
This is in a format where we can convert it into a pandas.DataFrame object for further processing.
[10]:
df_ev=pd.DataFrame([ev.split() for ev in events])
df_ev
[10]:
| 0 | 1 | 2 | 3 | 4 | 5 | 6 | 7 | 8 | |
|---|---|---|---|---|---|---|---|---|---|
| 0 | MSG | 3387245 | C_GW_1_1_UD_UD | None | None | None | None | None | None |
| 1 | MSG | 3390421 | F_GW_1_1_10_0 | None | None | None | None | None | None |
| 2 | MSG | 3392759 | C_NW_1_2_UD_UD | None | None | None | None | None | None |
| 3 | MSG | 3394293 | R_NW_1_2_UD_UD | None | None | None | None | None | None |
| 4 | MSG | 3395952 | F_NW_1_2_-1_0 | None | None | None | None | None | None |
| ... | ... | ... | ... | ... | ... | ... | ... | ... | ... |
| 1065 | MSG | 5893078 | V_UD_UD_16_UD_UD | None | None | None | None | None | None |
| 1066 | MSG | 5899076 | V_UD_UD_17_UD_UD | None | None | None | None | None | None |
| 1067 | MSG | 5905073 | V_UD_UD_18_UD_UD | None | None | None | None | None | None |
| 1068 | MSG | 5911072 | V_UD_UD_19_UD_UD | None | None | None | None | None | None |
| 1069 | MSG | 5917071 | V_UD_UD_20_UD_UD | None | None | None | None | None | None |
1070 rows × 9 columns
In this table, the second column contains the time-stamp (identical to the time-stamp in the samples file), and the third column contains our custom markers (the format like “C_GW_1_1_UD_UD” and so on is specific for our experimental design). There are many more columns which seem to contain no information in our samples. Let’s check what those columns are for by printing the rows in our data-frame where these columns are not None:
[11]:
df_ev[np.array(df_ev[4])!=None].head()
[11]:
| 0 | 1 | 2 | 3 | 4 | 5 | 6 | 7 | 8 | |
|---|---|---|---|---|---|---|---|---|---|
| 209 | MSG | 3900393 | RECCFG | CR | 500 | 2 | 1 | LR | None |
| 211 | MSG | 3900393 | GAZE_COORDS | 0.00 | 0.00 | 1919.00 | 1079.00 | None | None |
| 212 | MSG | 3900393 | THRESHOLDS | L | 56 | 231 | R | 66 | 239 |
| 213 | MSG | 3900393 | ELCL_WINDOW_SIZES | 176 | 188 | 0 | 0 | None | None |
| 215 | MSG | 3900393 | ELCL_PROC | CENTROID | (3) | None | None | None | None |
Apparently, there are more eye-tracker specific markers in our files (in this case due to drift-checks during the experiments). We can safely drop those from our set of interesting events by dropping all rows in which the fourth column is not None and then dropping all non-interesting columns.
[12]:
df_ev=df_ev[np.array(df_ev[4])==None][[1,2]]
df_ev.columns=["time", "event"]
df_ev
[12]:
| time | event | |
|---|---|---|
| 0 | 3387245 | C_GW_1_1_UD_UD |
| 1 | 3390421 | F_GW_1_1_10_0 |
| 2 | 3392759 | C_NW_1_2_UD_UD |
| 3 | 3394293 | R_NW_1_2_UD_UD |
| 4 | 3395952 | F_NW_1_2_-1_0 |
| ... | ... | ... |
| 1065 | 5893078 | V_UD_UD_16_UD_UD |
| 1066 | 5899076 | V_UD_UD_17_UD_UD |
| 1067 | 5905073 | V_UD_UD_18_UD_UD |
| 1068 | 5911072 | V_UD_UD_19_UD_UD |
| 1069 | 5917071 | V_UD_UD_20_UD_UD |
1035 rows × 2 columns
Finally, we can pass those event-markers into our PupilData-object.
[13]:
d=pp.PupilData(df.right_p, time=df.time, event_onsets=df_ev.time, event_labels=df_ev.event, name="test")
d
> Filling in 5 gaps
[32.35   4.012  6.21   2.02   1.862] seconds
[13]:
PupilData(test, 135.5MiB):
 n                 : 1268585
 nmiss             : 212551
 perc_miss         : 16.75496714843704
 nevents           : 1035
 nblinks           : 0
 ninterpolated     : 0
 blinks_per_min    : 0.0
 fs                : 500.0
 duration_minutes  : 42.28616666666667
 start_min         : 56.431666666666665
 end_min           : 98.7178
 baseline_estimated: False
 response_estimated: False
 History:
 *
The summary of the dataset shows us that the eyetracker started recording at time=56.4 minutes. We can reset the time index to start with 0 by using the reset_time() function.
[14]:
d=d.reset_time().blinks_detect()
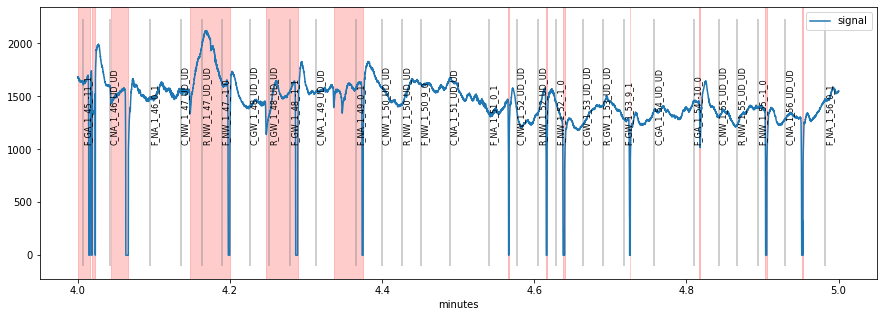
Now we can store away this dataset in pypillometry-format and use all the pypillometry-functions on it, e.g., plot a minute of this dataset.
[16]:
d.sub_slice(4, 6, units="min").drop_original().write_file("../data/test.pd")
[15]:
plt.figure(figsize=(15,5));
d.plot((4, 5), units="min")
Generalize to multiple similar datasets
Now that we have successfully found a way to create our PupilData structure from the raw .EDF files, we can wrap the code from this notebook into an easily accessible function that creates PupilData objects for a given .EDF file that has the same structure.
We simply create a function that takes the name of an EDF-file as input and runs all the code above, returning the final PupilData object. For convenience, we will assume that the EDF2ASC utility has already run such that .asc files are already available (see above for details).
[42]:
datapath="../data" ## this is where the datafiles are located

def read_dataset(edffile):
    basename=os.path.splitext(edffile)[0] ## remove .edf from filename
    fname_samples=os.path.join(datapath, basename+"_samples.asc")
    fname_events=os.path.join(datapath, basename+"_events.asc")

    print("> Attempt loading '%s' and '%s'"%(fname_samples, fname_events))
    ## read samples-file
    df=pd.read_table(fname_samples, index_col=False,
                  names=["time", "left_x", "left_y", "left_p",
                         "right_x", "right_y", "right_p"])

    ## read events-file
    # read the whole file into variable `events` (list with one entry per line)
    with open(fname_events) as f:
        events=f.readlines()

    # keep only lines starting with "MSG"
    events=[ev for ev in events if ev.startswith("MSG")]
    # remove events before experiment start
    experiment_start_index=np.where(["experiment_start" in ev for ev in events])[0][0]
    events=events[experiment_start_index+1:]

    # re-arrange as described above
    df_ev=pd.DataFrame([ev.split() for ev in events])
    df_ev=df_ev[np.array(df_ev[4])==None][[1,2]]
    df_ev.columns=["time", "event"]

    # create `PupilData`-object
    d=pp.PupilData(df.right_p, time=df.time, event_onsets=df_ev.time, event_labels=df_ev.event, name=edffile)
    return d
We can test this code by simply running the function with a certain filename located in datapath:
[43]:
read_dataset("test.edf")
> Attempt loading '../data/test_samples.asc' and '../data/test_events.asc'
> Filling in 5 gaps
[32.35   4.012  6.21   2.02   1.862] seconds
[43]:
PupilData(test.edf, 135.5MiB):
 n                 : 1268585
 nmiss             : 212551
 perc_miss         : 16.75496714843704
 nevents           : 1035
 nblinks           : 0
 ninterpolated     : 0
 blinks_per_min    : 0.0
 fs                : 500.0
 duration_minutes  : 42.28616666666667
 start_min         : 56.431666666666665
 end_min           : 98.7178
 baseline_estimated: False
 response_estimated: False
 History:
 *
Storing/Loading several datasets
So now it is easy to read a set of datasets into a Python list from the same experimental setup with a simple loop, e.g.,
[46]:
files=["test.edf", "test2.edf", "test3.edf"]
datasets=[read_dataset(fname) for fname in files]
> Attempt loading '../data/test_samples.asc' and '../data/test_events.asc'
> Filling in 5 gaps
[32.35   4.012  6.21   2.02   1.862] seconds
After that, we might want to save the final PupilData objects as .pd files that can be readily loaded back. Here, we loop through the list of datasets and store each of them in separate files using the name attribute of the object as filename.
[47]:
for ds in datasets:
    fname=os.path.join(datapath, ds.name+".pd")
    ds.write_file(fname)
These datasets can be read back using the PupilData.from_file() method:
[58]:
# all filenames in `datapath` that end with `.pd`
pd_files=[fname for fname in os.listdir(datapath) if fname.endswith(".pd")]
datasets=[]
for fname in pd_files:
    fname=os.path.join(datapath, fname)
    d=pp.PupilData.from_file(fname)
    datasets.append(d)
It is also possible to store the whole list as a single file by using the pd_write_pickle()-function:
[60]:
pp.pd_write_pickle(datasets, "full_dataset.pd")
which can be read-back using the pd_read_pickle() function like so:
[61]:
datasets=pp.pd_read_pickle("full_dataset.pd")
Interactive version: