

Experimental setup and regions of interest#
Experimental: Regions of interest work, but the API may change. For event-related analyses (where the gaze is after each event, dwell time and first entry per trial), use the segments and seg.gaze: see Regions of interest and the tutorial Gaze in regions of interest around events.
Gaze positions are recorded in screen pixels. To relate them to what was on the screen, or to express them in mm or degrees of visual angle, pypillometry needs the geometry of the setup. Regions of interest (ROIs) then mark parts of the screen, e.g., where stimuli were shown.
[1]:
import pypillometry as pp
from pypillometry import u
import numpy as np
import matplotlib.pyplot as plt

pp.logging_set_level("WARNING")

d = pp.get_example_data("rlmw_002_short")
The experimental setup#
The geometry is stored in d.experimental_setup. For Eyelink files, the screen resolution is read from the file; the example dataset also has the physical screen size and the distance from the eye to the screen:
[2]:
d.experimental_setup
[2]:
ExperimentalSetup(
  screen=1280x1024px
  physical=300x200mm
  d=600mm
)
Missing values are set (or changed) with set_experimental_setup(). Lengths and angles take units:
d.set_experimental_setup(physical_screen_size=("30 cm", "20 cm"),
                         eye_to_screen_center=60 * u.cm)
With this information, the setup converts between pixels, mm (relative to the screen center, y up) and degrees of visual angle:
[3]:
setup = d.experimental_setup
print(setup.pixels_to_degrees(1280, 512))   # right edge, middle
print(setup.degrees_to_pixels(-8, 0))       # 8 degrees left of the center
(np.float64(14.036243467926479), np.float64(0.0))
(np.float64(280.2154631618779), np.float64(512.0))
It also defines the screen boundaries, which are used, e.g., by gaze.mask_offscreen() to mask samples outside the screen.
Where did the participant look?#
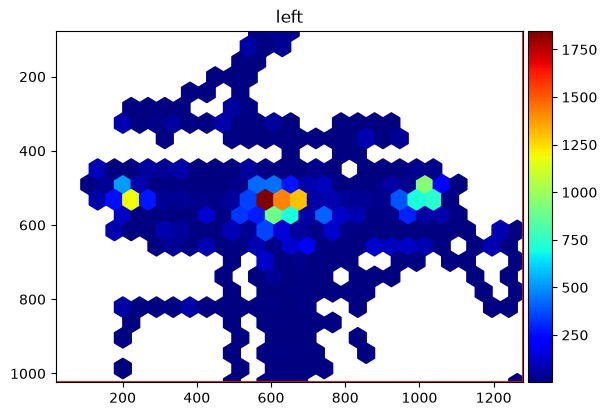
In this task, two stimuli were shown to the left and right of the screen center. A heatmap of the gaze positions of the left eye shows them as two clusters next to the central fixation point:
[4]:
d.plot.plot_heatmap(eyes="left");
Defining regions of interest#
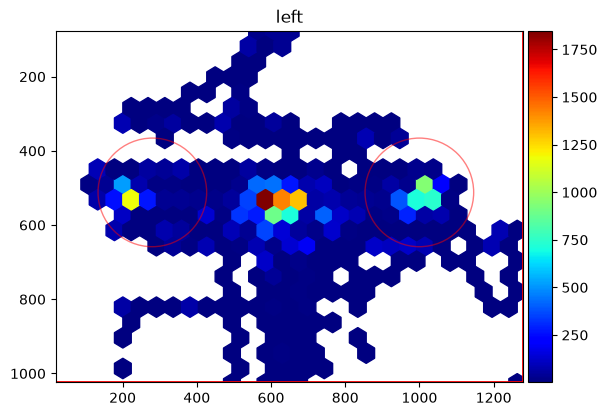
ROIs are circles (CircularROI) or rectangles (RectangularROI). They are stored in pixels, but can be created from mm or degrees with from_mm() and from_degrees(). Here, two circles with a radius of 3°, 8° to the left and right of the center:
[5]:
left_roi = pp.CircularROI.from_degrees(("-8 deg", "0 deg"), "3 deg",
                                       setup=setup, name="left stimulus")
right_roi = pp.CircularROI.from_degrees(("8 deg", "0 deg"), "3 deg",
                                        setup=setup, name="right stimulus")
left_roi, right_roi
[5]:
(CircularROI(name=left stimulus)(center=[280.21546316 512.        ], radius=146.36063450682056),
 CircularROI(name=right stimulus)(center=[999.78453684 512.        ], radius=146.36063450682056))
plot_heatmap() shows ROIs on top of the data:
[6]:
d.plot.plot_heatmap(eyes="left", rois=[left_roi, right_roi]);
Which samples are in a region?#
contains() takes an array of (x, y) positions and returns True for those inside the region. For single points, in works as well:
[7]:
print((280, 512) in left_roi)

gaze = np.column_stack([d["left_x"], d["left_y"]])
in_left = left_roi.contains(gaze)
in_right = right_roi.contains(gaze)
print(f"left: {in_left.mean():.1%}, right: {in_right.mean():.1%} of samples")
True
left: 14.6%, right: 18.7% of samples
Combining ROIs with intervals and events#
The result is a boolean array with one value per sample, so it can be converted to intervals: the periods in which the participant looked at the left stimulus. Very short visits are removed with filter():
[8]:
visits = pp.Intervals.from_mask(in_left, d, units="ms", label="left stimulus")
visits = visits.filter(min_duration=100 * u.ms)
visits
[8]:
Intervals 'left stimulus' | 18 intervals (total duration: 5768.00 ms), 320.44 ms +/- 163.24 ms, [166.00 ms, 844.00 ms]
To get the proportion of time spent on the left stimulus after each stimulus onset, we store the boolean array as a new variable and use stat_per_event():
The segments around events do this per time point and trial: seg.gaze.dwell_time(left_roi, window=(0, 1000)) returns the time in the ROI per trial, and seg.gaze.roi_hits() the share of trials in the ROI over time (see the tutorial).
[9]:
d["left", "in_left_roi"] = in_left.astype(float)
props = d.stat_per_event(window=(0, 1000) * u.ms, event_select="S_",
                         eyes="left", variables="in_left_roi")
props["left_in_left_roi"]
[9]:
array([0.418, 0.4  , 0.476, 0.494, 0.25 , 0.366, 0.248, 0.386, 0.342,
       0.414])