Event-Related Pupil Dilations
We are often interested in how the pupil responds to certain events, for example stimuli. On method to investigate this question is to extract the average pupil-dilation surrounding the events of interest.
[1]:
import sys
sys.path.insert(0,"..") # this is not needed if you have installed pypillometry
import pypillometry as pp
import pylab as plt
import numpy as np
import pylab as plt
Here, we will use the dataset created in the importdata example. We download this dataset test.pd from the Github page.
[2]:
d=pp.PupilData.from_file("https://github.com/ihrke/pypillometry/raw/master/data/test.pd")
Next, we apply a basic blink-detection and interpolation pipeline as illustrated in the blinks example.
[3]:
d2=d.blinks_detect(min_offset_len=2)\
        .blinks_merge(100)\
        .blinks_interp_mahot(margin=(50,150))\
        .lowpass_filter(cutoff=5)\
        .scale()

plt.figure(figsize=(15,5))
plot_range=(3,4)
d2.plot(plot_range, units="min")
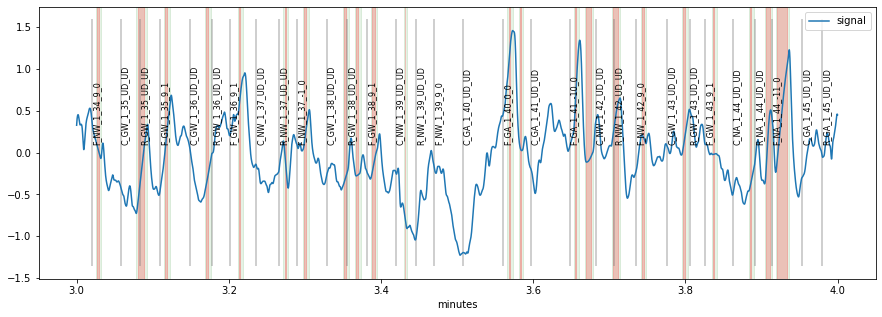
Next, we want to create ERPDs based on some of the event-markers in this dataset. The markers in this set have a special structure where each label consists of information about experimental condition, block etc. We can take a look at the first few events:
[68]:
list(d2.event_labels[0:5])
[68]:
['C_GW_1_1_UD_UD',
 'F_GW_1_1_10_0',
 'C_NW_1_2_UD_UD',
 'R_NW_1_2_UD_UD',
 'F_NW_1_2_-1_0']
The first letter contains information about which stimulus was presented, the letter combination after the first underscore codes the experimental condition. We can use the dataset’s get_erpd() function to extract the pupillary signal in the vicinity of some of these events. For that, we have to indicates which events we want to select by providing the event_select argument to that function. We start by extracting all stimuli coded as “C” (cues) by providing event_select="C_" as an
argument. This will match all labels that contain the string “C_” somewhere. We set the name of the object to "cue" to distinguish this ERPD from others we will create soon. Finally, we apply a baseline-correction using the baseline_win parameter (setting this to None results in no baseline correction).
[69]:
erpd_cue=d2.get_erpd("cue", event_select="C_", baseline_win=(-200,0))
erpd_cue
[69]:
ERPD(cue):
 nevents: 75
 n      : 1250
 window : (-500.0, 2000.0)
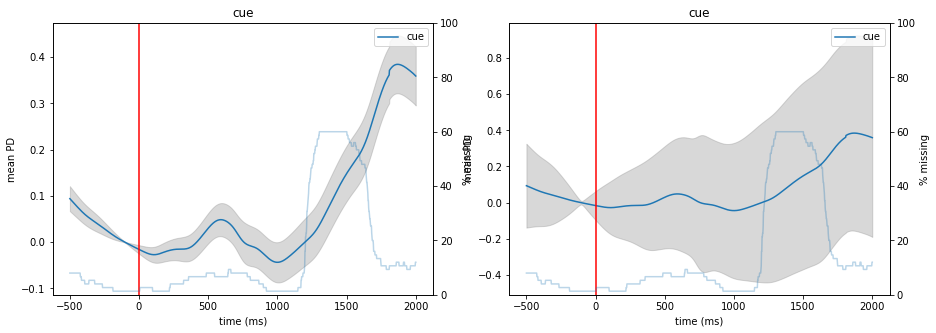
This ERPD contains data from 75 trials and goes from 500 ms before the cue-onset until 2000 ms post-cue onset. We can use the plot() function of that object to visualize the curve. In addition to the mean curve and its standard error, we also get the percentage of missing (interpolated) datapoints in the dataset (the light blue curve). We can choose what is displayed as the errorbars by passing a function to varfct. For example, we can use varfct=np.std to display standard deviation
instead of standard error.
[78]:
plt.figure(figsize=(15,5))
plt.subplot(121)
erpd_cue.plot()
plt.subplot(122)
erpd_cue.plot(varfct=np.std)
Sometimes, extracting labels based on string-matching alone is not sufficient. For example, in our current dataset, we would like to compare cues (labels starting with “C_”) that come from condition “GW” and “NA” against the cues from conditions “NW” and “GA” (what exactly that means is not so important for the present purposes). We can achieve that by passing a filter-function as argument event_select instead of passing a string. Such a function should return True whenever a label
should be used and False when it should not be used. Here is an example of two such functions, one for cues from the “GW”/NA” conditions (call them “congruent”) and one for the “NW”/”GA” conditions (call them “conflict”).
[72]:
def is_conflict_cue(x):
    xs=x.split("_")
    if len(xs)>=2 and xs[0]=="C" and xs[1] in ["NW","GA"]:
        return True
    else:
        return False
def is_congruent_cue(x):
    xs=x.split("_")
    if len(xs)>=2 and xs[0]=="C" and xs[1] in ["GW","NA"]:
        return True
    else:
        return False
First, the label is split into parts using the substring “_”. Further, we return True only when the first element is a “C” and the second element is one of the relevant conditions. We can try whether this function works, by applying them to some labels:
[73]:
is_congruent_cue("C_GW"), is_congruent_cue("C_GA")
[73]:
(True, False)
We can now get to ERPD objects, one for each of the filter-functions.
[74]:
erpd_conf=d2.get_erpd("conflict",  event_select=is_conflict_cue,  baseline_win=(-200,0))
erpd_cong=d2.get_erpd("congruent", event_select=is_congruent_cue, baseline_win=(-200,0))
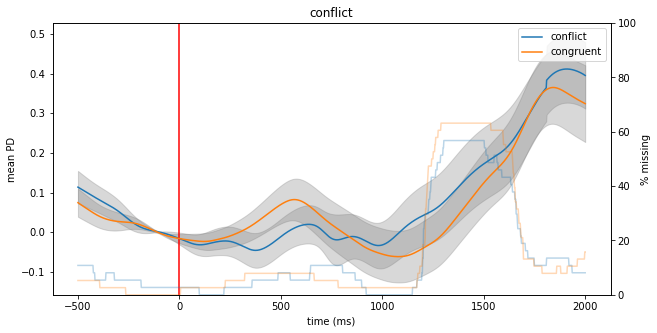
Finally, we can plot the two objects together. For that, we can pass one of the objects as an additional argument to the plot() function of the other one:
[75]:
plt.figure(figsize=(10,5))
erpd_conf.plot(overlays=erpd_cong)