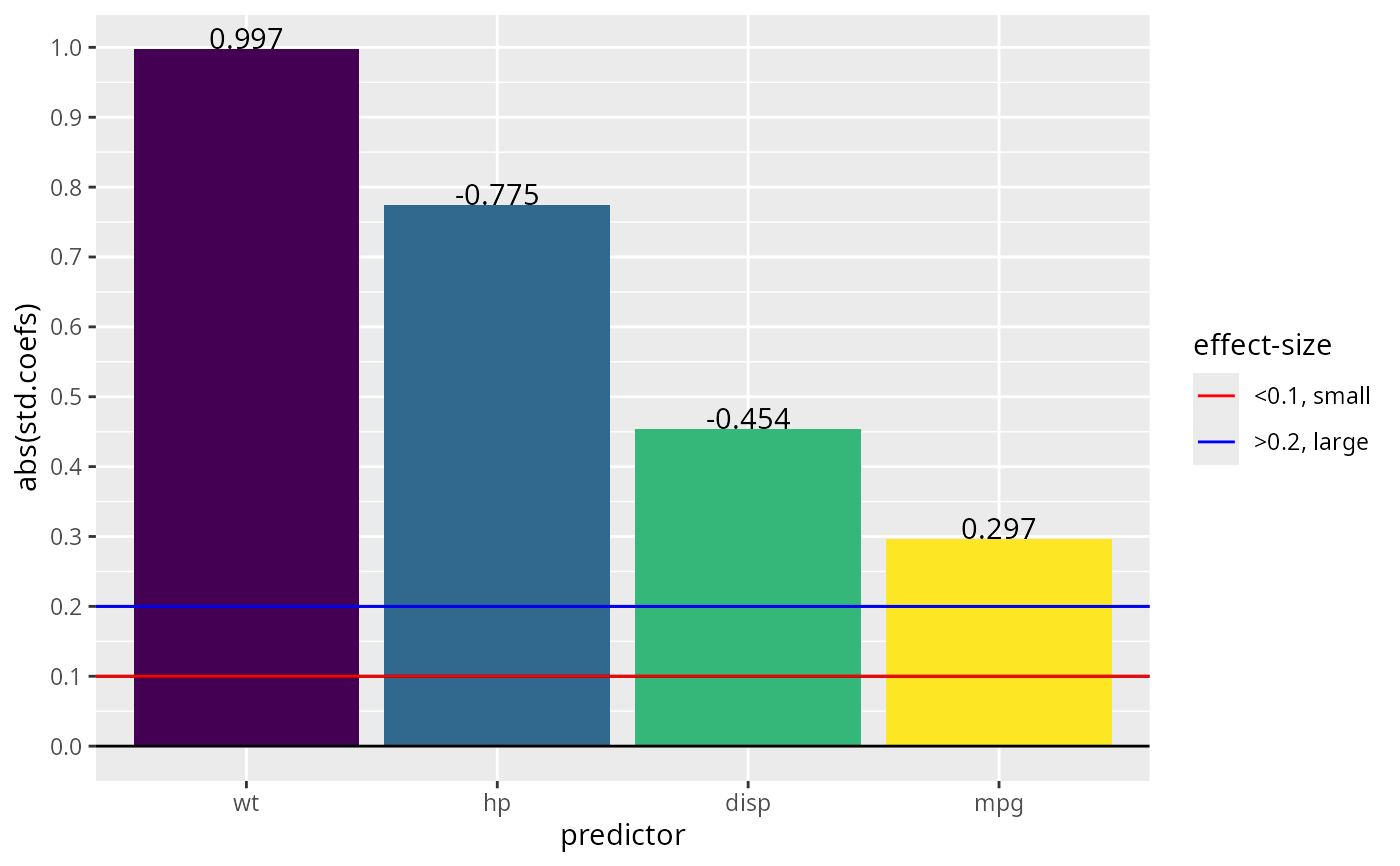
This function visually displays the importance of predictors in a regression model based on the magnitude of the completely standardised coefficients.
vimp(regmod)Examples
mymodel <- lm(qsec ~ disp + mpg + hp + wt, data=mtcars)
vimp(mymodel)
#>
#> Attaching package: ‘dplyr’
#> The following objects are masked from ‘package:stats’:
#>
#>     filter, lag
#> The following objects are masked from ‘package:base’:
#>
#>     intersect, setdiff, setequal, union
#> Warning: The `<scale>` argument of `guides()` cannot be `FALSE`. Use "none" instead as
#> of ggplot2 3.3.4.
#> ℹ The deprecated feature was likely used in the astatur package.
#>   Please report the issue at <https://github.com/ihrke/astatur/issues>.
